• Acta Optica Sinica
  • Vol. 43, Issue 6, 0630001 (2023)
Qing Chen1, Bin Tang1、*, Junfeng Miao1, Yan Zhou3, Zourong Long1、**, Jinfu Zhang1, Jianxu Wang1, Mi Zhou1, Binqiang Ye1、2, Mingfu Zhao1, and Nianbing Zhong1
Author Affiliations
  • 1Chongqing Key Laboratory of Fiber Optic Sensor and Photodetector, Chongqing University of Technology, Chongqing 400054, China
  • 2School of Microelectronics and Communication Engineering, Chongqing University, Chongqing 400044, China
  • 3Tongliang District Environmental Protection Bureau of Chongqing, Chongqing 402560, China
  • show less
    DOI: 10.3788/AOS221518 Cite this Article Set citation alerts
    Qing Chen, Bin Tang, Junfeng Miao, Yan Zhou, Zourong Long, Jinfu Zhang, Jianxu Wang, Mi Zhou, Binqiang Ye, Mingfu Zhao, Nianbing Zhong. Water Sample Classification and Fluorescence Component Identification Based on Fluorescence Spectrum[J]. Acta Optica Sinica, 2023, 43(6): 0630001 Copy Citation Text show less
    Overall flow of PARAFAC method
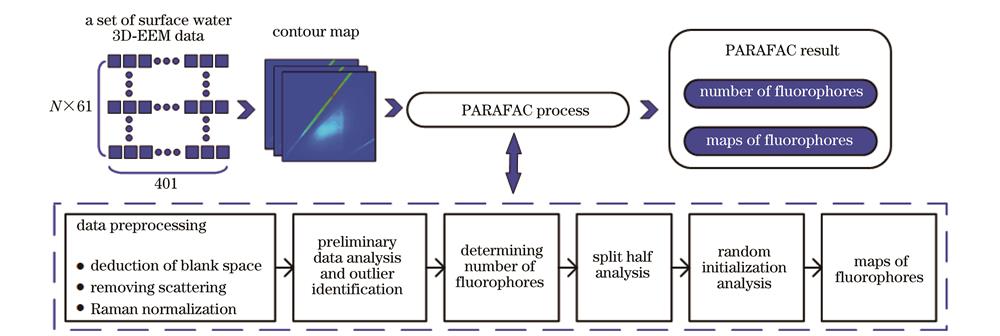
    Fig. 1. Overall flow of PARAFAC method
    CNN fast classification and recognition model
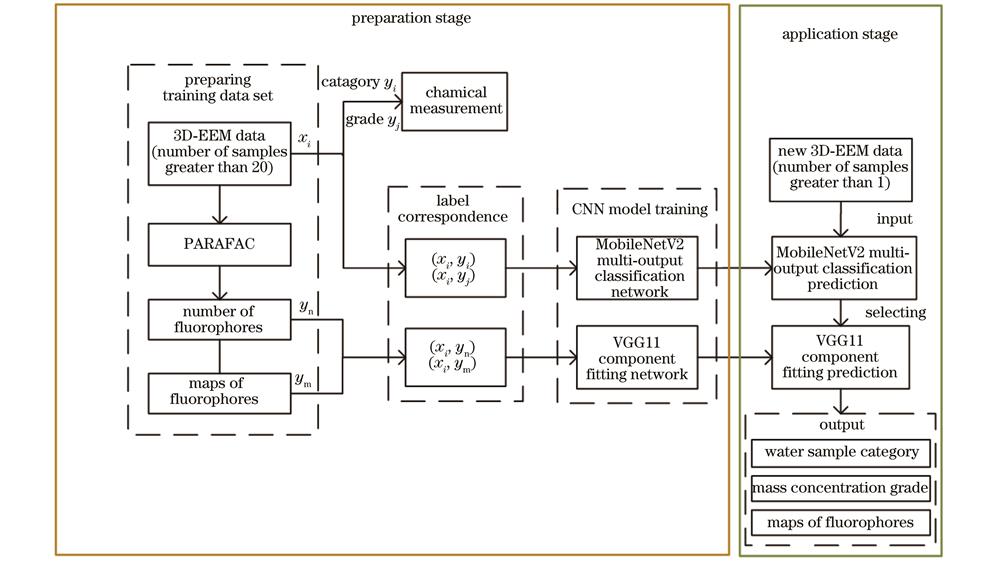
    Fig. 2. CNN fast classification and recognition model
    3D-EEM classification network based on MobileNetV2
    Fig. 3. 3D-EEM classification network based on MobileNetV2
    3D-EEM fitting network based on CF-VGG11. (a) Structural diagram of single-layer CF-VGG11 network; (b) structural diagram of whole fitting network
    Fig. 4. 3D-EEM fitting network based on CF-VGG11. (a) Structural diagram of single-layer CF-VGG11 network; (b) structural diagram of whole fitting network
    Analysis process of PARAFAC method
    Fig. 5. Analysis process of PARAFAC method
    Analysis results of DB obtained by PAFARAC. (a) Component maps; (b) results of split half verification corresponding to loading component maps
    Fig. 6. Analysis results of DB obtained by PAFARAC. (a) Component maps; (b) results of split half verification corresponding to loading component maps
    PARAFAC result of 3D-EEM spectrum and fitting component map obtained by CNN model. (a) WS water sample; (b) XCYY water sample
    Fig. 7. PARAFAC result of 3D-EEM spectrum and fitting component map obtained by CNN model. (a) WS water sample; (b) XCYY water sample
    TypeLabelNumber
    Surface waterDB51
    Treatment water of industrial wastewaterFS127
    Inlet and outlet water of sewage treatment plantWS37
    Rural drinking waterXCYY58
    Table 1. Water sample collection
    TypeComponentλex /nmλem /nmFluorescent substanceNumber of OpenFluor matches
    DBC1370464Humic acid2311
    C2315384Microbial humus2421
    C3290,395460Terrestrial humus254
    C4360,395526Soil fulvic acid261
    FSC1350428Waste water collection tracer2717
    C2275,400480Terrestrial humus251
    C3360,395526Soil fulvic acid261
    C4315384Microbial humus287
    WSC1<270,365465Terrestrial humus292
    C2345409Humus like substance301
    C3295369Microbial humus318
    C4275,420488Microbial humus323
    XCYYC1345429Anthropogenic humus339
    C2390454Fulvic acid and humus341
    C3<270,365465Terrestrial humus354
    C4360,395526Soil fulvic acid261
    Table 2. Spectral characteristics of EEM seen from comparison results of PARAFAC components and OpenFluor database
    Network modelAccuracy of training setAccuracy of test setLoss value of training setLoss value of test set
    MobileNetV2_199.6598.610.25002.0000
    MobileNetV2_299.3095.832.380012.6000
    CF-VGG1199.6098.110.08790.0455
    Table 3. Results of model training
    ModelData quantity requirementOperation environmentTime costAnalysis process
    PARAFAC≥20MATLABHighComplex
    MobileNetV2+CF-VGG11≥1PythonLowSimple
    Table 4. Comparison between PARAFAC method and proposed model
    Qing Chen, Bin Tang, Junfeng Miao, Yan Zhou, Zourong Long, Jinfu Zhang, Jianxu Wang, Mi Zhou, Binqiang Ye, Mingfu Zhao, Nianbing Zhong. Water Sample Classification and Fluorescence Component Identification Based on Fluorescence Spectrum[J]. Acta Optica Sinica, 2023, 43(6): 0630001
    Download Citation