
Ruifeng Zhang, Chang Liu. Interference Fringe Center Point Extraction Method Based on Interval Curve Fitting[J]. Laser & Optoelectronics Progress, 2021, 58(8): 0812002
- Laser & Optoelectronics Progress
- Vol. 58, Issue 8, 0812002 (2021)
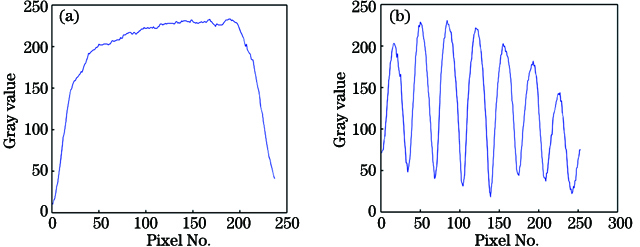
Fig. 1. Grayscale distribution of interference fringe. (a) Tangential direction; (b) normal direction
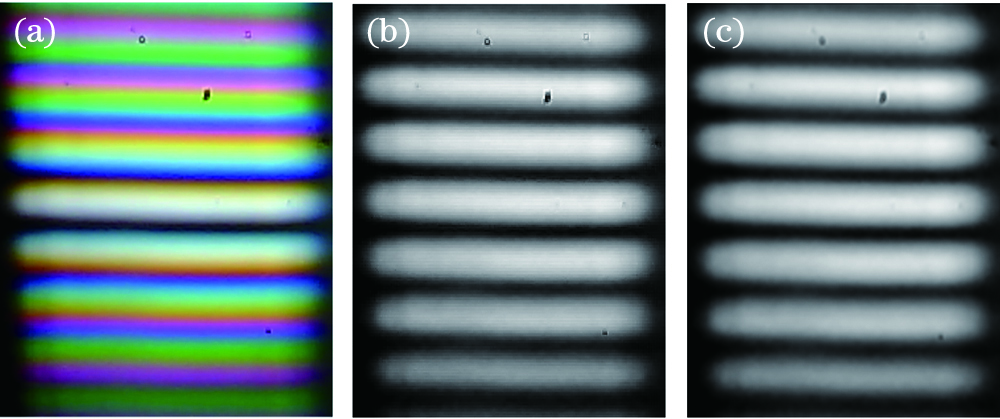
Fig. 2. Interference fringe patterns. (a) Original image; (b) R-value image; (c) Gaussian filter image
Fig. 3. Grayscale along normal direction. (a) Original image; (b) after Gaussian filtering
Fig. 4. Schematic of interval fitting
Fig. 5. Results of curve fitting. (a) f1(x); (b) f2(x)
Fig. 6. Images of f1(x) and f2(x) and filtered image
Fig. 7. Image of f(x)=f2(x)-f1(x)
Fig. 8. Extraction results. (a) Interference fringe pattern; (b) centerline extraction result
Fig. 9. Interference fringe patterns. (a) Image 1; (b) image 2; (c) image 3; (d) image 4; (e) image 5
Fig. 10. Known centerline images. (a) Image 6; (b) image 7; (c) image 8; (d) image 9; (e) image 10
|
Table 1. Comparison of statistical parameters of three curve fitting methods
| |||||||||||||||||||||||||||||||||||
Table 2. Comparison of average processing time of extracting results by four methods
| |||||||||||||||||||||||||||||||||||
Table 3. RMSE comparison between the extraction results of the four methods and the standard value

Set citation alerts for the article
Please enter your email address
© Copyright 2018-2021 | Chinese Laser Press. All Rights Reserved 沪ICP备15018463号-20