Author Affiliations
1Key Laboratory of Optical Calibration and Characterization, Anhui Institute of Optics and Fine Mechanics, Chinese Academy of Sciences, Hefei, Anhui 230031, China2Hefei Institute of Physical Science, Chinese Academy of Sciences, Hefei, Anhui 230031, China3National Satellite Ocean Application Service, Beijing 100089, Chinashow less
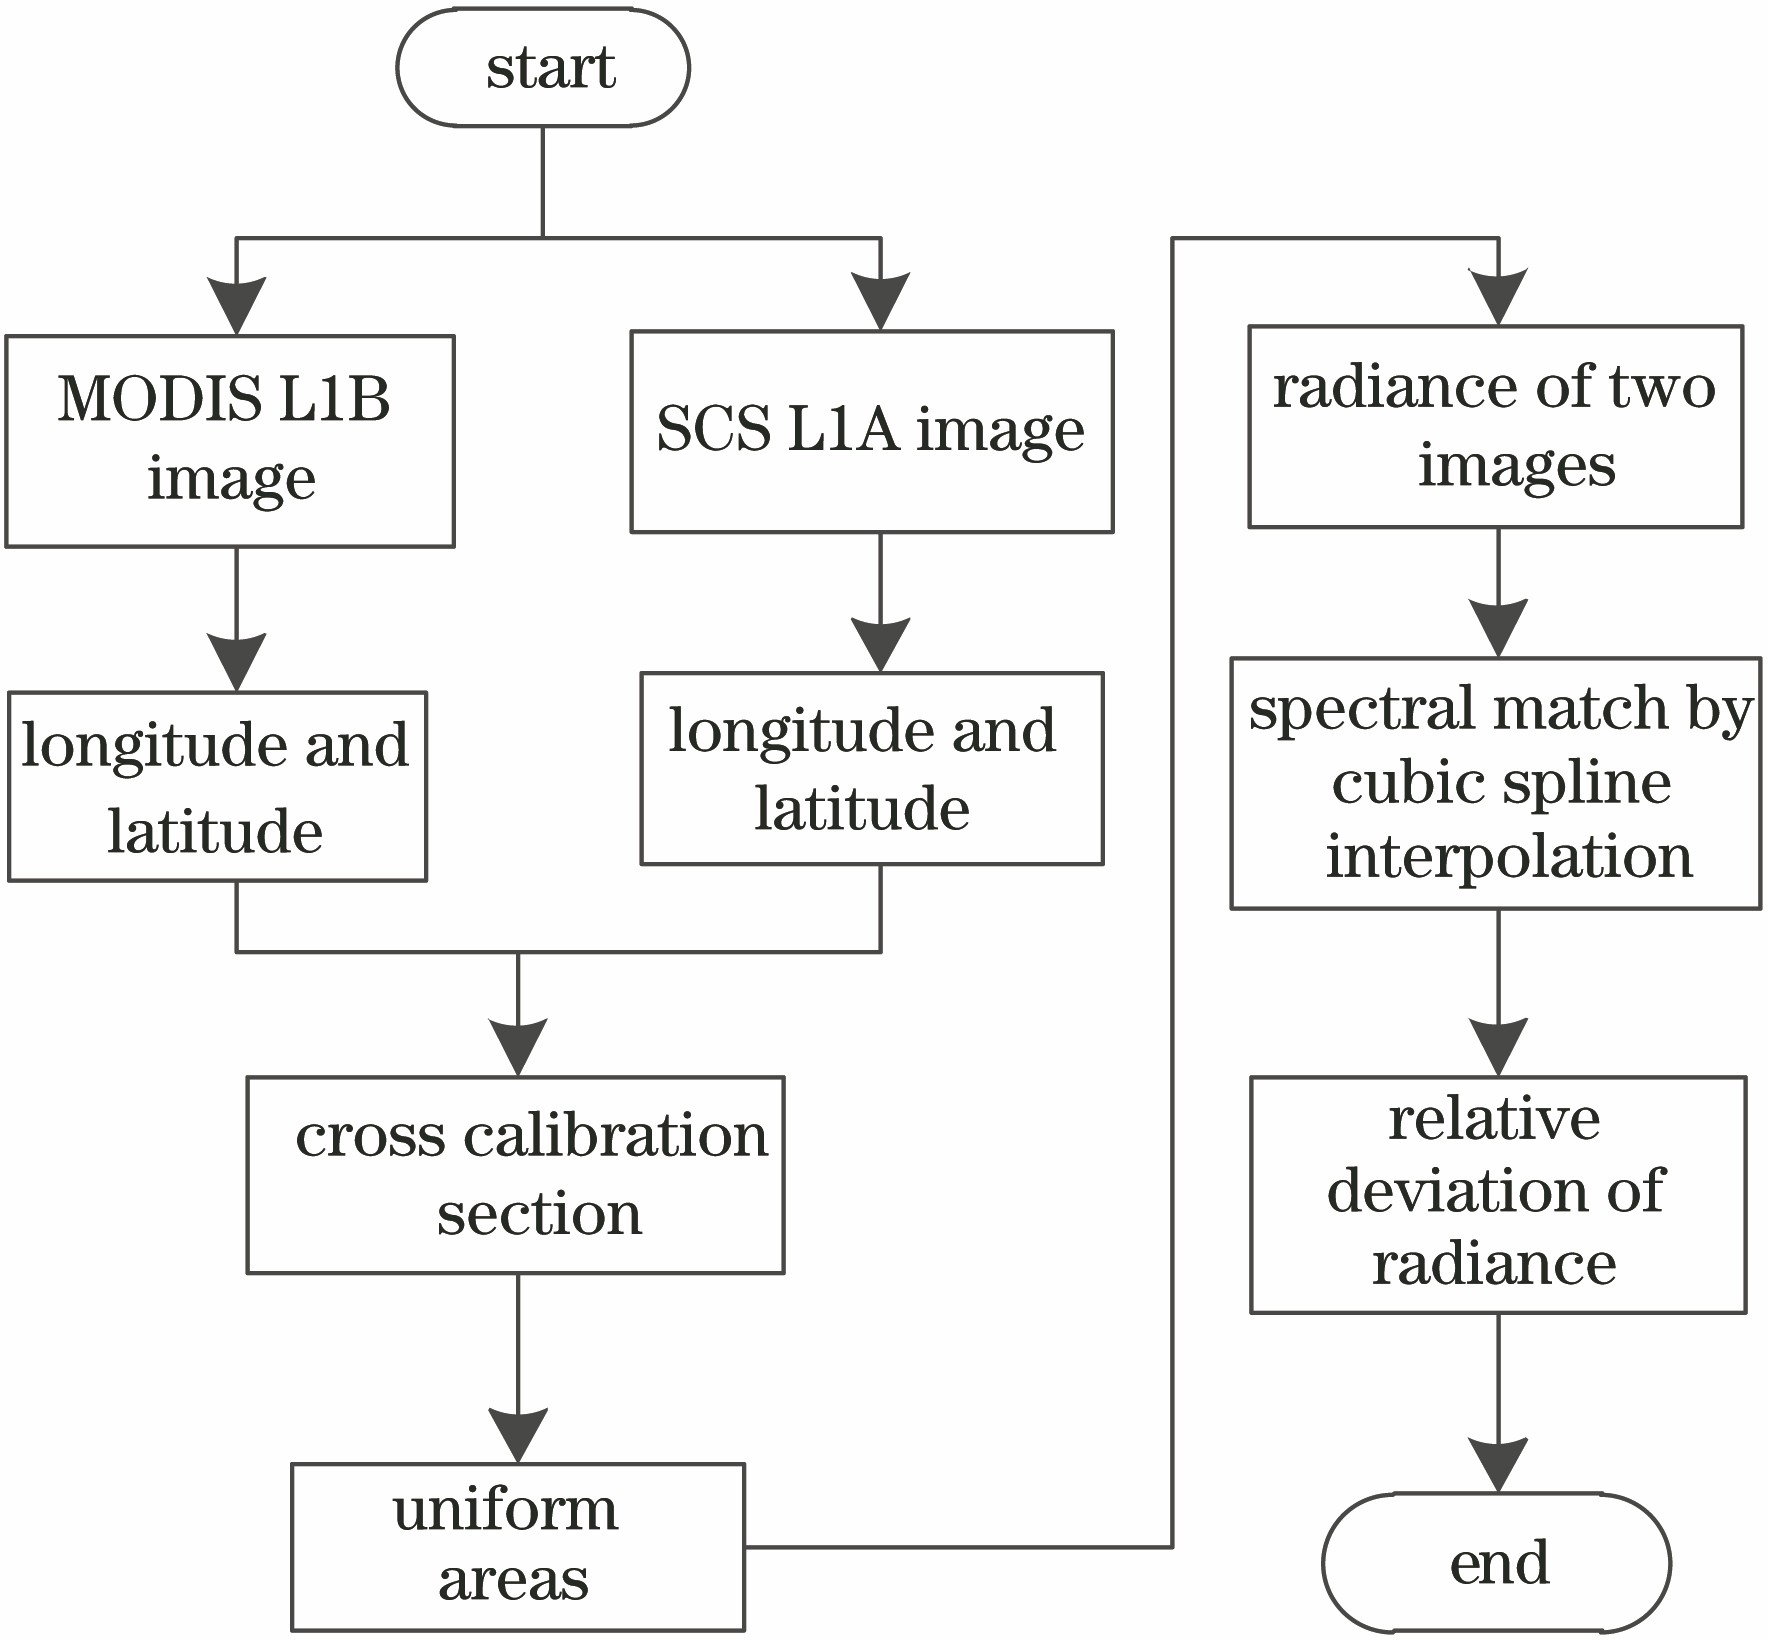
Fig. 1. Flow chart of the cross validation
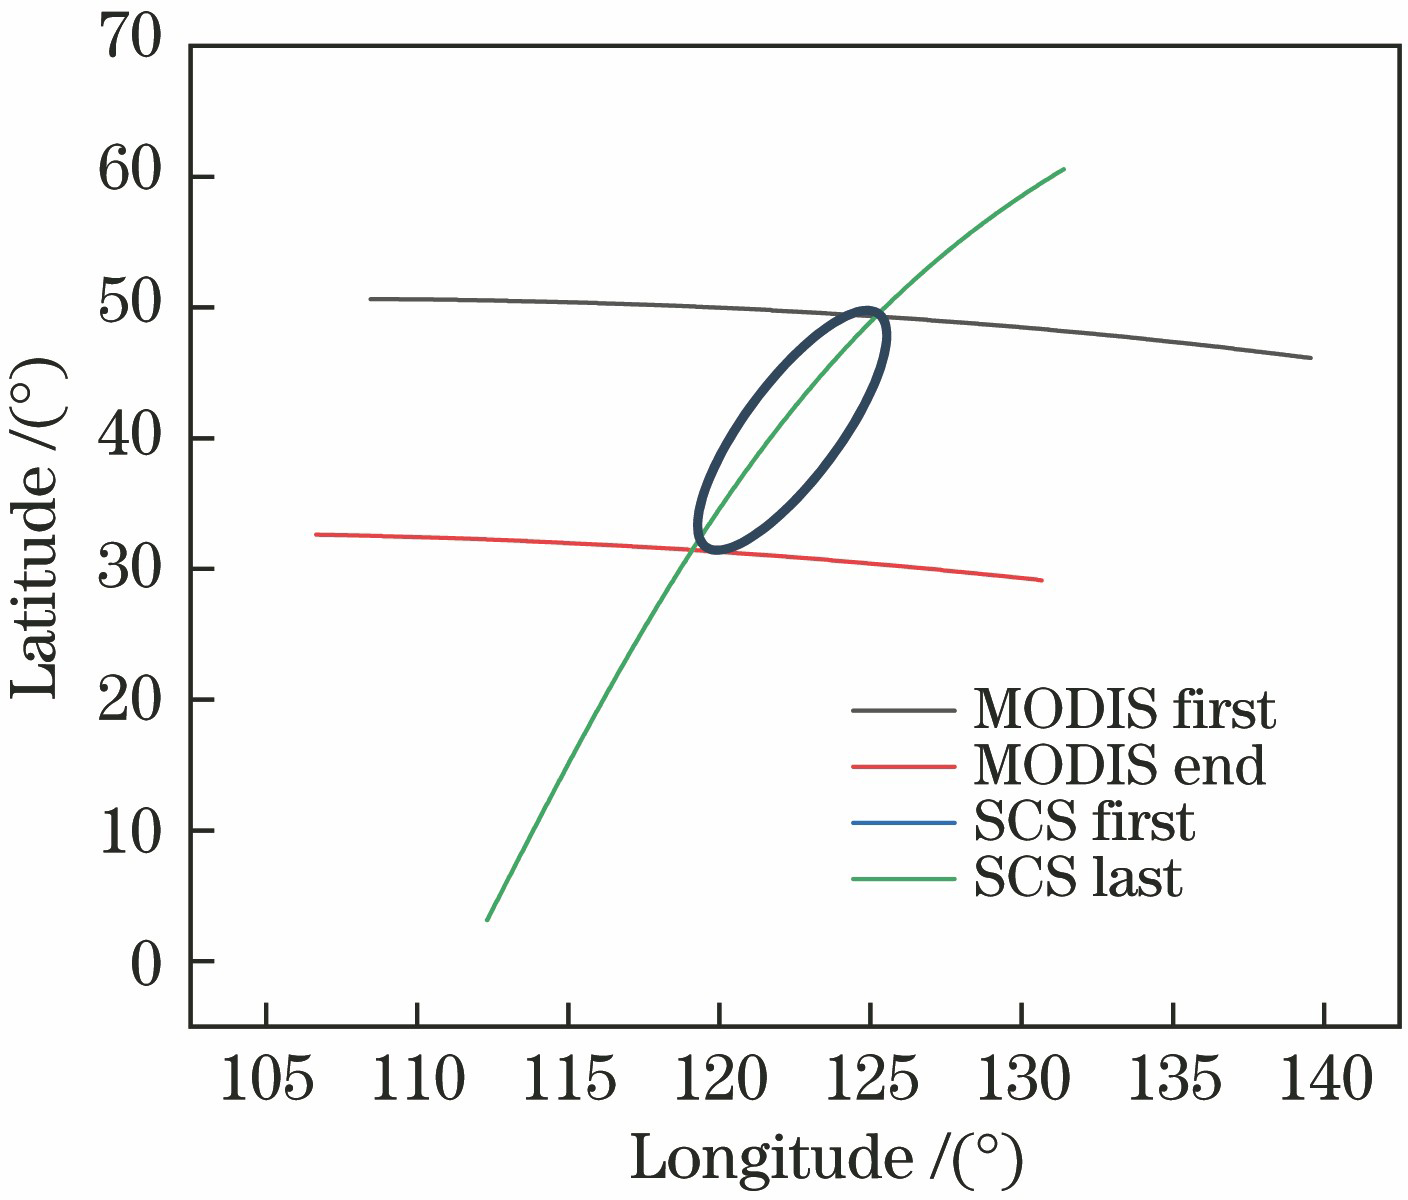
Fig. 2. Common region of SCS and MODIS obtained on January 24, 2019
Fig. 3. Texture matching in the common region of SCS and MODIS
Fig. 4. Cross calibration region in the MODIS image obtained on January 24, 2019
Fig. 5. Radiance and reflectance from SCS and MODIS images obtained on January 24, 2019
Fig. 6. Cross calibration regions in the MODIS image. (a) Uniform region selected on February 28, 2019; (b) uniform region selected on March 13, 2019; (c) uniform region selected on April 4,2019
Fig. 7. Radiance and reflectance results from SCS and MODIS images obtained on February 28, 2019. (a) Radiance; (b) reflectance
Fig. 8. Radiance and reflectance results from SCS and MODIS images obtained on March 13, 2019. (a) Radiance; (b) reflectance
Fig. 9. Radiance and reflectance results from SCS and MODIS images obtained on April 4, 2019. (a) Radiance; (b) reflectance
Sensor | Average | Standard deviation | Uniformity /% |
---|
SCS | 8908.000 | 95.940 | 1.08 | MODIS | 13558.148 | 417.247 | 3.08 |
|
Table 1. Statistic results of image data in the selected regions from SCS and MODIS obtained on January 24, 2019
Sensor | Solar zenith | Solar azimuth | View zenith | View azimuth |
---|
SCS | 61.278 | 159.021 | 0 | 291.2880 | MODIS | 61.050 | 160.100 | 1.690 | -85.3700 |
|
Table 2. Solar and view angles in the selected regions from SCS and MODIS on January 24, 2019(°)
Band | Radiance deviation /(μW·cm-2·sr·nm-1) | Reflectance deviation |
---|
B8 | 0.012 | 0.016 | B9 | 0.016 | 0.012 | B10 | 0.009 | 0.017 | B11 | 0.029 | 0.036 | B12 | 0.011 | 0.009 | B13 | 0.048 | 0.054 | B14 | 0.076 | 0.083 | B15 | 0.037 | 0.046 |
|
Table 3. Deviation statistics of radiance and reflectance obtained on January 24, 2019
Date | Sensor | Average | Standard deviation | Uniformity /% |
---|
2019-02-28 | SCS | 8600.0 | 83.542 | 0.97 | 2019-02-28 | MODIS | 9834.2 | 119.289 | 1.21 | 2019-03-13 | SCS | 9532.8 | 90.302 | 0.95 | 2019-03-13 | MODIS | 11178.0 | 55.864 | 0.50 | 2019-04-04 | SCS | 7211.3 | 73.047 | 1.01 | 2019-04-04 | MODIS | 7914.5 | 70.045 | 0.89 |
|
Table 4. Statistic results of image data in the selected regions from SCS and MODIS on different dates
Date | Sensor | Solar zenith | Solar azimuth | View zenith | View azimuth |
---|
2019-02-28 | SCS | 34.571 | 135.424 | 0 | 180.203 | 2019-02-28 | MODIS | 34.390 | 135.800 | 4.3600 | 103.400 | 2019-03-13 | SCS | 30.443 | 130.025 | 0 | 180.158 | 2019-03-13 | MODIS | 30.040 | 130.680 | 1.1100 | 104.050 | 2019-04-04 | SCS | 35.942 | 150.039 | 0.1811 | 142.627 | 2019-04-04 | MODIS | 35.950 | 150.030 | 2.9200 | 98.410 |
|
Table 5. Solar and view angles in the selected regions from SCS and MODIS on different dates(°)
Band | Radiance deviation | Average |
---|
2019-01-24 | 2019-02-28 | 2019-03-13 | 2019-04-04 |
---|
B8 | 0.014 | 0.009 | 0.007 | 0.012 | 0.011 | B9 | 0.011 | 0.007 | 0.008 | 0.023 | 0.012 | B10 | 0.008 | 0.017 | 0.010 | 0.010 | 0.011 | B11 | 0.044 | 0.054 | 0.039 | 0.041 | 0.045 | B12 | 0.027 | 0.043 | 0.024 | 0.024 | 0.030 | B13 | 0.021 | 0.016 | 0.016 | 0.011 | 0.016 | B14 | 0.047 | 0.015 | 0.018 | 0.011 | 0.023 | B15 | 0.029 | 0.053 | 0.011 | 0.032 | 0.031 |
|
Table 6. Verification results of radiance(μW·cm-2·sr·nm-1)
Band | Reflectance deviation | Average |
---|
2019-01-24 | 2019-02-28 | 2019-03-13 | 2019-04-04 |
---|
B8 | 0.014 | 0.013 | 0.011 | 0.013 | 0.013 | B9 | 0.008 | 0.007 | 0.010 | 0.016 | 0.010 | B10 | 0.007 | 0.014 | 0.009 | 0.022 | 0.013 | B11 | 0.026 | 0.035 | 0.028 | 0.030 | 0.030 | B12 | 0.016 | 0.025 | 0.016 | 0.033 | 0.023 | B13 | 0.012 | 0.006 | 0.007 | 0.054 | 0.020 | B14 | 0.029 | 0.006 | 0.008 | 0.056 | 0.025 | B15 | 0.010 | 0.016 | 0.005 | 0.067 | 0.025 |
|
Table 7. Verification results of reflectance
Uncertainty factor | Uncertainty |
---|
BRDF | 0.80 | Uniformity (including attenuation screen) | 0.60 | Incident solar angle | 0.35 | Transmittance of attenuation screen | 0.50 | Pre-launch monitoring | 0.50 | Reference diffuser | 0.54 | Solar irradiance | 1.00 | Stray light and other factors | 1.00 | Synthetic uncertainty | 1.97 |
|
Table 8. Radiance uncertainty of on-board caibration%
Band | Calibration capability |
---|
2019-01-24 | 2019-02-28 | 2019-03-13 | 2019-04-04 |
---|
B8 | 0.512 | 0.838 | 0.730 | 0.589 | B9 | 0.462 | 0.497 | 0.465 | 0.335 | B10 | 0.055 | 0.272 | 0.134 | 0.236 | B11 | 0.507 | 0.690 | 0.421 | 0.719 | B12 | 0.251 | 0.543 | 0.210 | 0.542 | B13 | 0.582 | 0.152 | 0.517 | 0.166 | B14 | 0.890 | 0.319 | 0.420 | 0.287 | B15 | 0.165 | 0.851 | 0.112 | 0.776 |
|
Table 9. Verification results of on-board calibration capability