• Acta Optica Sinica
  • Vol. 40, Issue 1, 111010 (2020)
Pan Xingchen1、2、*, Liu Cheng1、2, Tao Hua1、2, Liu Haigang3, and Zhu Jianqiang1、2
Author Affiliations
  • 1Key Laboratory of High Power Laser and Physics, Shanghai Institute of Optics and Fine Mechanics, Chinese Academy of Sciences, Shanghai 201800, China
  • 2National Laboratory on High Power Laser and Physics, China Academy of Engineering Physics, Chinese Academy of Sciences, Shanghai 201800, China
  • 3Shanghai Synchrotron Radiation Facility, Shanghai Advanced Research Institute, Chinese Academy of Sciences, Shanghai 201204, China
  • show less
    DOI: 10.3788/AOS202040.0111010 Cite this Article Set citation alerts
    Pan Xingchen, Liu Cheng, Tao Hua, Liu Haigang, Zhu Jianqiang. Phase Imaging Based on Ptychography and Progress on Related Key Techniques[J]. Acta Optica Sinica, 2020, 40(1): 111010 Copy Citation Text show less
    Schematic of basic optical path of Ptychography
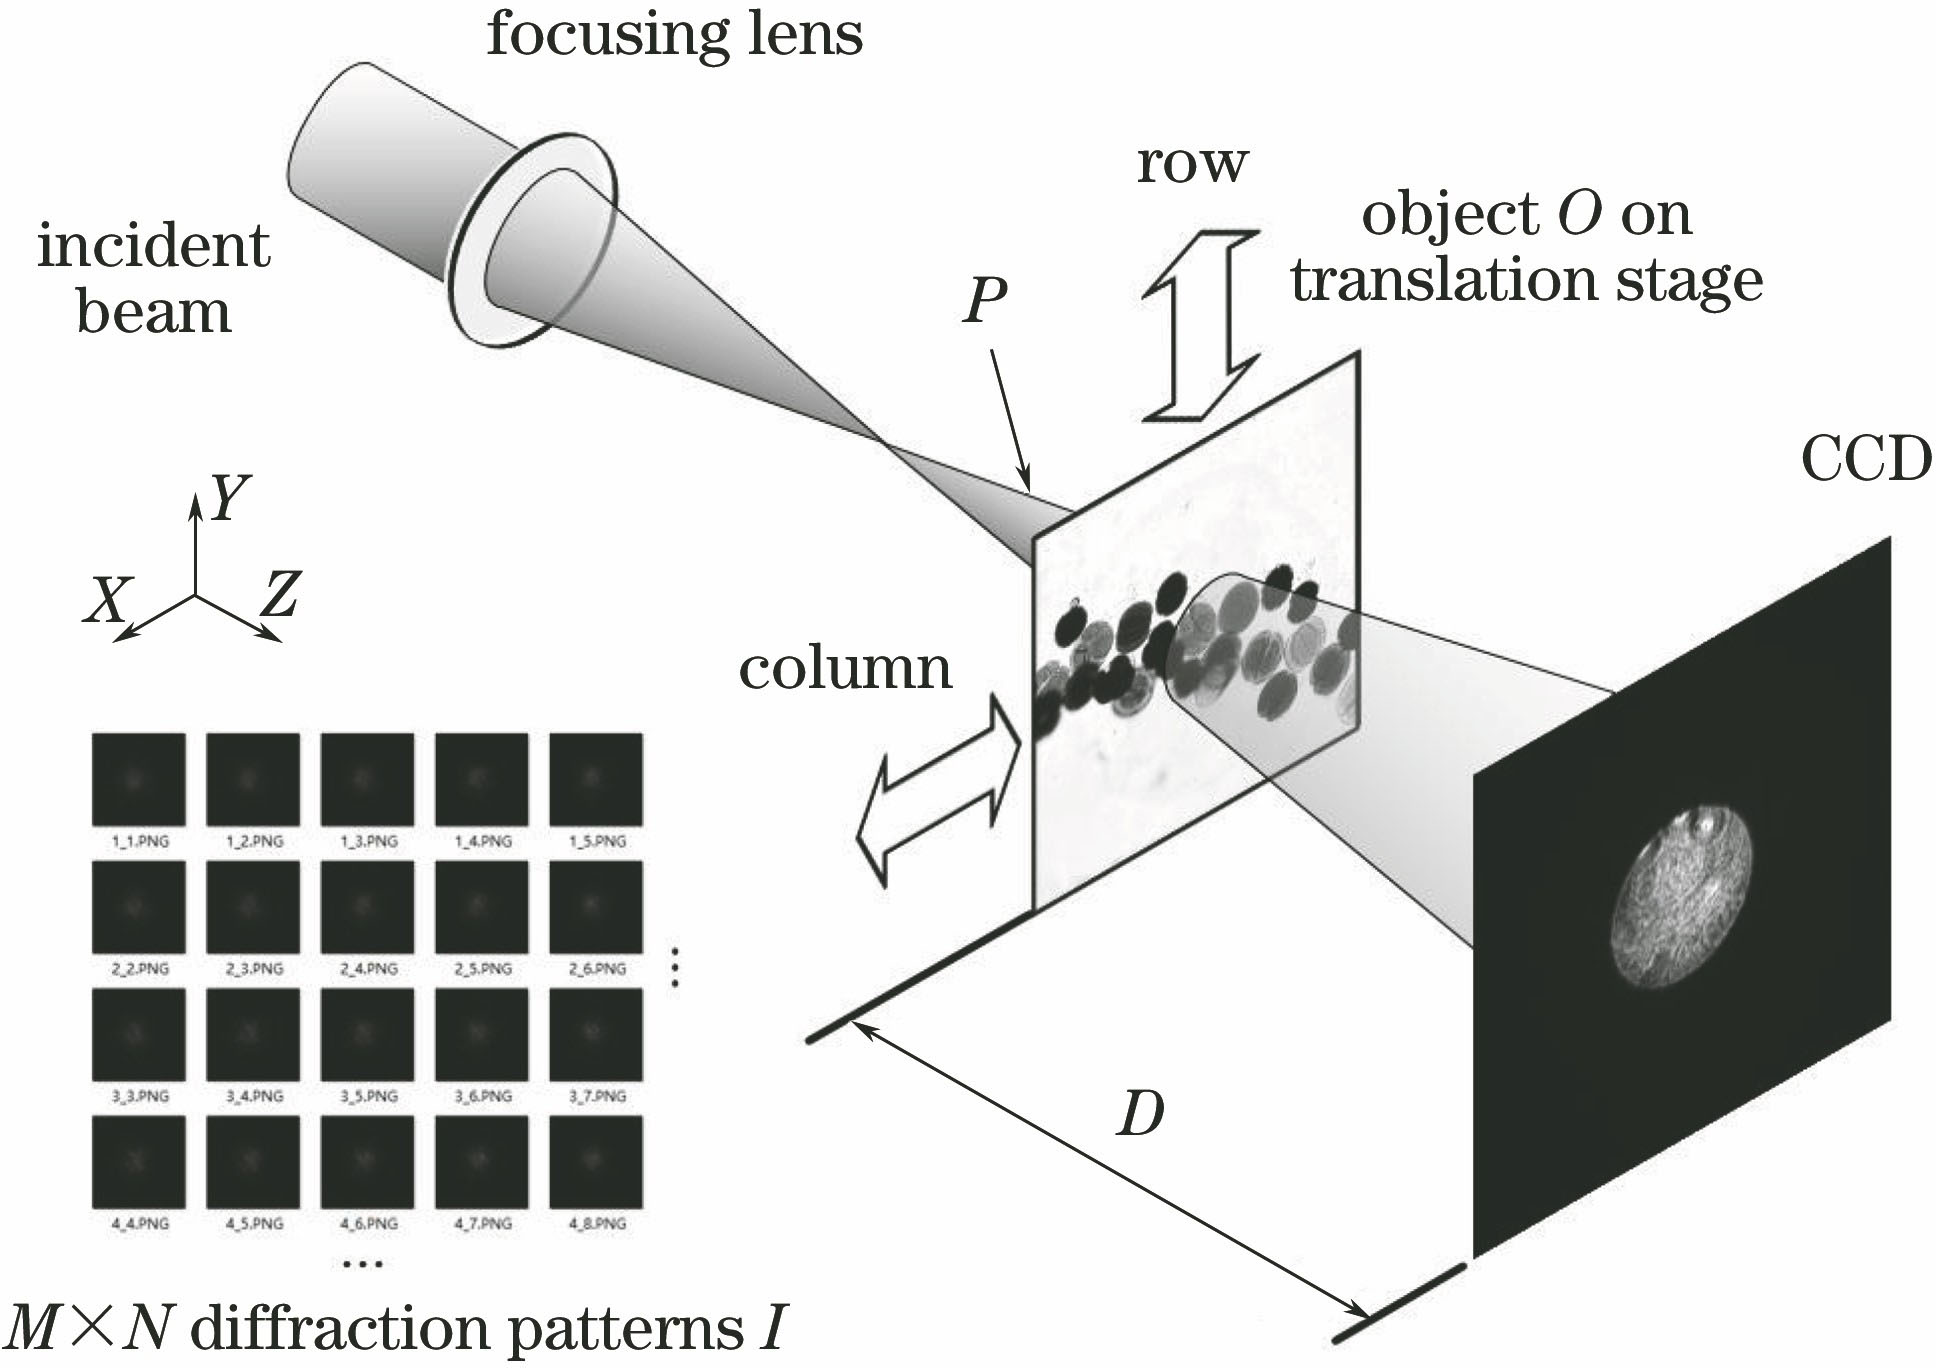
    Fig. 1. Schematic of basic optical path of Ptychography
    Flow chart of primary iteration for single-layer Ptychography
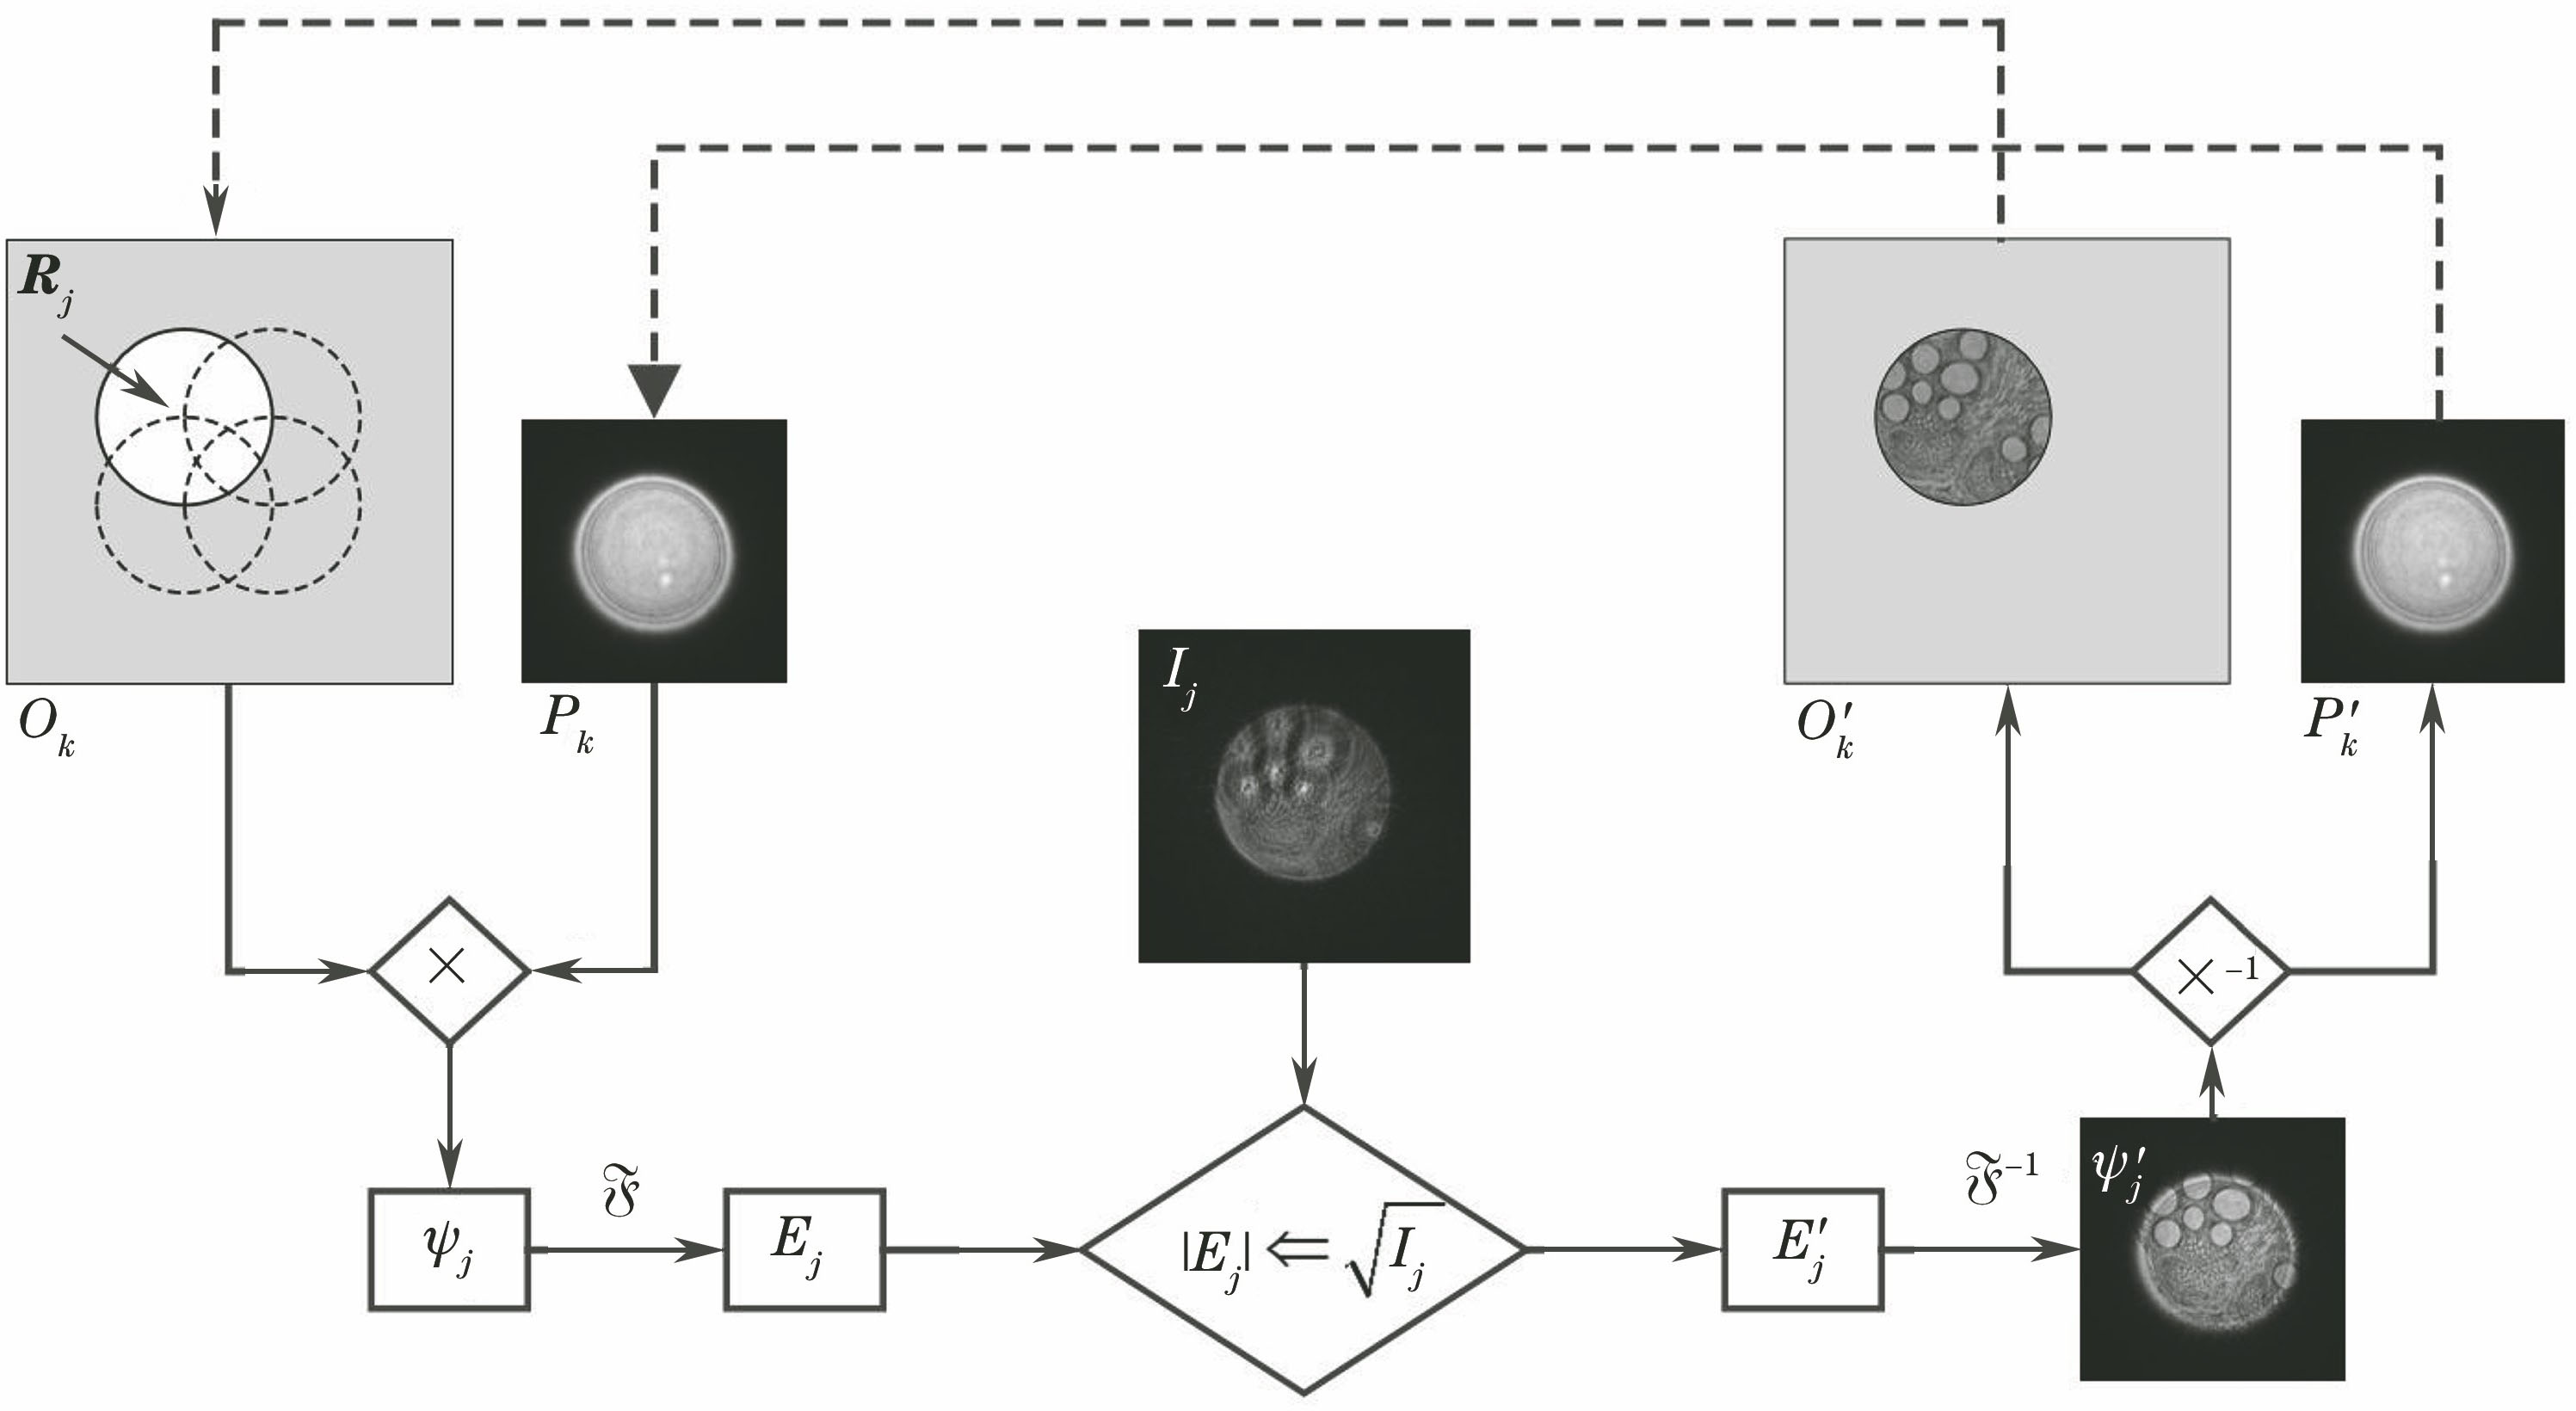
    Fig. 2. Flow chart of primary iteration for single-layer Ptychography
    Amplitude and phase distributions of specimen reconstructed by ePIE. (a) Amplitude; (b) phase
    Fig. 3. Amplitude and phase distributions of specimen reconstructed by ePIE. (a) Amplitude; (b) phase
    Flow chart of multi-mode Ptychography algorithm
    Fig. 4. Flow chart of multi-mode Ptychography algorithm
    Reconstructed results of wavefront. (a)-(c) Experimental results with partially coherent X-rays[13]. (a) is result reconstructed by single-mode Ptychography and (b)(c) are distributions of specimen and lighting probes reconstructed by 12-mode Ptychography, respectively [43]; (d) left-bottom inset is reconstructed results of multi-mode color imaging and top-right inset is imaging result under white
    Fig. 5. Reconstructed results of wavefront. (a)-(c) Experimental results with partially coherent X-rays[13]. (a) is result reconstructed by single-mode Ptychography and (b)(c) are distributions of specimen and lighting probes reconstructed by 12-mode Ptychography, respectively [43]; (d) left-bottom inset is reconstructed results of multi-mode color imaging and top-right inset is imaging result under white
    Influence of translation error on reconstructed results. (a)(b) Reconstructed amplitude and phase of specimen and lighting probe with scanning errors; (c)(d) reconstructed amplitude and phase of specimen and lighting probe with accurate positions
    Fig. 6. Influence of translation error on reconstructed results. (a)(b) Reconstructed amplitude and phase of specimen and lighting probe with scanning errors; (c)(d) reconstructed amplitude and phase of specimen and lighting probe with accurate positions
    Principle of correlation matching algorithm. (a) Reconstructed amplitude of object at first position; (b) reconstructed amplitudes of object at two positions
    Fig. 7. Principle of correlation matching algorithm. (a) Reconstructed amplitude of object at first position; (b) reconstructed amplitudes of object at two positions
    Experimental results[14]. (a) Resolution plate reconstructed without position correction; (b) reconstructed result of correlation matching algorithm with position correction
    Fig. 8. Experimental results[14]. (a) Resolution plate reconstructed without position correction; (b) reconstructed result of correlation matching algorithm with position correction
    Basic schematic of annealing algorithm
    Fig. 9. Basic schematic of annealing algorithm
    Imaging results of gold/graphite particles under electron beam microscopy[15]. (a) Reconstructed result before position corrections; (b) reconstructed result after position corrections by annealing algorithm
    Fig. 10. Imaging results of gold/graphite particles under electron beam microscopy[15]. (a) Reconstructed result before position corrections; (b) reconstructed result after position corrections by annealing algorithm
    Influence of distance errors. (a) Schematic of actual optical path; (b) equivalent optical path for distance measurement with error
    Fig. 11. Influence of distance errors. (a) Schematic of actual optical path; (b) equivalent optical path for distance measurement with error
    Simulation results[51] (unit of scale bar is 100 pixel). (a) Real distribution of specimen; (b) reconstructed result when distance is reduced by half; (c) reconstructed result after lighting probe multiplies lens factor when distance is reduced by half
    Fig. 12. Simulation results[51] (unit of scale bar is 100 pixel). (a) Real distribution of specimen; (b) reconstructed result when distance is reduced by half; (c) reconstructed result after lighting probe multiplies lens factor when distance is reduced by half
    Schematic of super resolution. (a) Light spot recorded by facular detector with limited numerical aperture; (b) schematic of amplitude updating algorithm
    Fig. 13. Schematic of super resolution. (a) Light spot recorded by facular detector with limited numerical aperture; (b) schematic of amplitude updating algorithm
    Experimental results of super resolution[17]. (a)(b) Amplitude and phase distributions of pollens reconstructed by standard PIE; (c)(d) amplitude and phase distributions of pollens reconstructed by SR-PIE
    Fig. 14. Experimental results of super resolution[17]. (a)(b) Amplitude and phase distributions of pollens reconstructed by standard PIE; (c)(d) amplitude and phase distributions of pollens reconstructed by SR-PIE
    Results of reconstruction experiments when light spots are partially saturated[54]. (a)-(d) Light spots with increasing saturated area from 0; (e)-(h) resolution-plate distributions reconstructed by corresponding saturated light spots in Figs. 15(a)-(d)
    Fig. 15. Results of reconstruction experiments when light spots are partially saturated[54]. (a)-(d) Light spots with increasing saturated area from 0; (e)-(h) resolution-plate distributions reconstructed by corresponding saturated light spots in Figs. 15(a)-(d)
    Schematic of amplitude updating algorithm for under-sampling
    Fig. 16. Schematic of amplitude updating algorithm for under-sampling
    Experimental results. (a)-(d) Under-sampled diffraction spots and corresponding reconstructed results; (e)-(h) diffraction spots after linear interpolation for spot in Fig. 17(a) and corresponding reconstructed results; (i)-(l) diffraction spot, lighting probe, and resolution plate reconstructed by under-sampled Ptychography algorithm
    Fig. 17. Experimental results. (a)-(d) Under-sampled diffraction spots and corresponding reconstructed results; (e)-(h) diffraction spots after linear interpolation for spot in Fig. 17(a) and corresponding reconstructed results; (i)-(l) diffraction spot, lighting probe, and resolution plate reconstructed by under-sampled Ptychography algorithm
    Experimental results with X-rays. (a)-(d) Normal sampling; (c)-(h) sampling rate decreased to 1/8; (i)-(l) sampling rate decreased to 1/16
    Fig. 18. Experimental results with X-rays. (a)-(d) Normal sampling; (c)-(h) sampling rate decreased to 1/8; (i)-(l) sampling rate decreased to 1/16
    Schematic of basic optical path of 3PIE
    Fig. 19. Schematic of basic optical path of 3PIE
    Experimental results of 3PIE stratified imaging[16]. (a)(d) Images of different focusing slices recorded by microscope; (b)(c) amplitude reconstructed by 3PIE; (e)(f) phase reconstructed by 3PIE
    Fig. 20. Experimental results of 3PIE stratified imaging[16]. (a)(d) Images of different focusing slices recorded by microscope; (b)(c) amplitude reconstructed by 3PIE; (e)(f) phase reconstructed by 3PIE
    Basic principal of standard Ptychography. (a) Traditional position-by-position scanning mode; (b) continuous recording mode; (c) decomposition of continuous recording process into multiple independent modes
    Fig. 21. Basic principal of standard Ptychography. (a) Traditional position-by-position scanning mode; (b) continuous recording mode; (c) decomposition of continuous recording process into multiple independent modes
    Experimental results of Fly-PIE[59]. (a)-(d) Diffraction spots recorded by continuous exposure when specimen is translated with different speeds; (e) reconstructed results with single and multiple modes; (f) reconstructed lighting probes with multiple modes
    Fig. 22. Experimental results of Fly-PIE[59]. (a)-(d) Diffraction spots recorded by continuous exposure when specimen is translated with different speeds; (e) reconstructed results with single and multiple modes; (f) reconstructed lighting probes with multiple modes
    Schematic of single-exposure Ptychography based on grating splitting
    Fig. 23. Schematic of single-exposure Ptychography based on grating splitting
    Experimental results reconstructed by Ptychography based on grating splitting [19]. (a) Light spots; (b) reconstructed amplitude of specimen; (c) reconstructed phase of specimen
    Fig. 24. Experimental results reconstructed by Ptychography based on grating splitting [19]. (a) Light spots; (b) reconstructed amplitude of specimen; (c) reconstructed phase of specimen
    Schematic of single-exposure Ptychography based on 4f system
    Fig. 25. Schematic of single-exposure Ptychography based on 4f system
    Experimental results with single-exposure Ptychography based on 4f system[20]. (a) (b) Reconstructed amplitude and phase of specimen; (c) reconstructed lighting probe; (d) direct-imaging result
    Fig. 26. Experimental results with single-exposure Ptychography based on 4f system[20]. (a) (b) Reconstructed amplitude and phase of specimen; (c) reconstructed lighting probe; (d) direct-imaging result
    Pan Xingchen, Liu Cheng, Tao Hua, Liu Haigang, Zhu Jianqiang. Phase Imaging Based on Ptychography and Progress on Related Key Techniques[J]. Acta Optica Sinica, 2020, 40(1): 111010
    Download Citation