
Fang Wang, Jichuan Xing. Novel Intelligent Long-Distance Optical Fiber Pre-Warning Algorithm[J]. Acta Optica Sinica, 2021, 41(7): 0706002
- Acta Optica Sinica
- Vol. 41, Issue 7, 0706002 (2021)
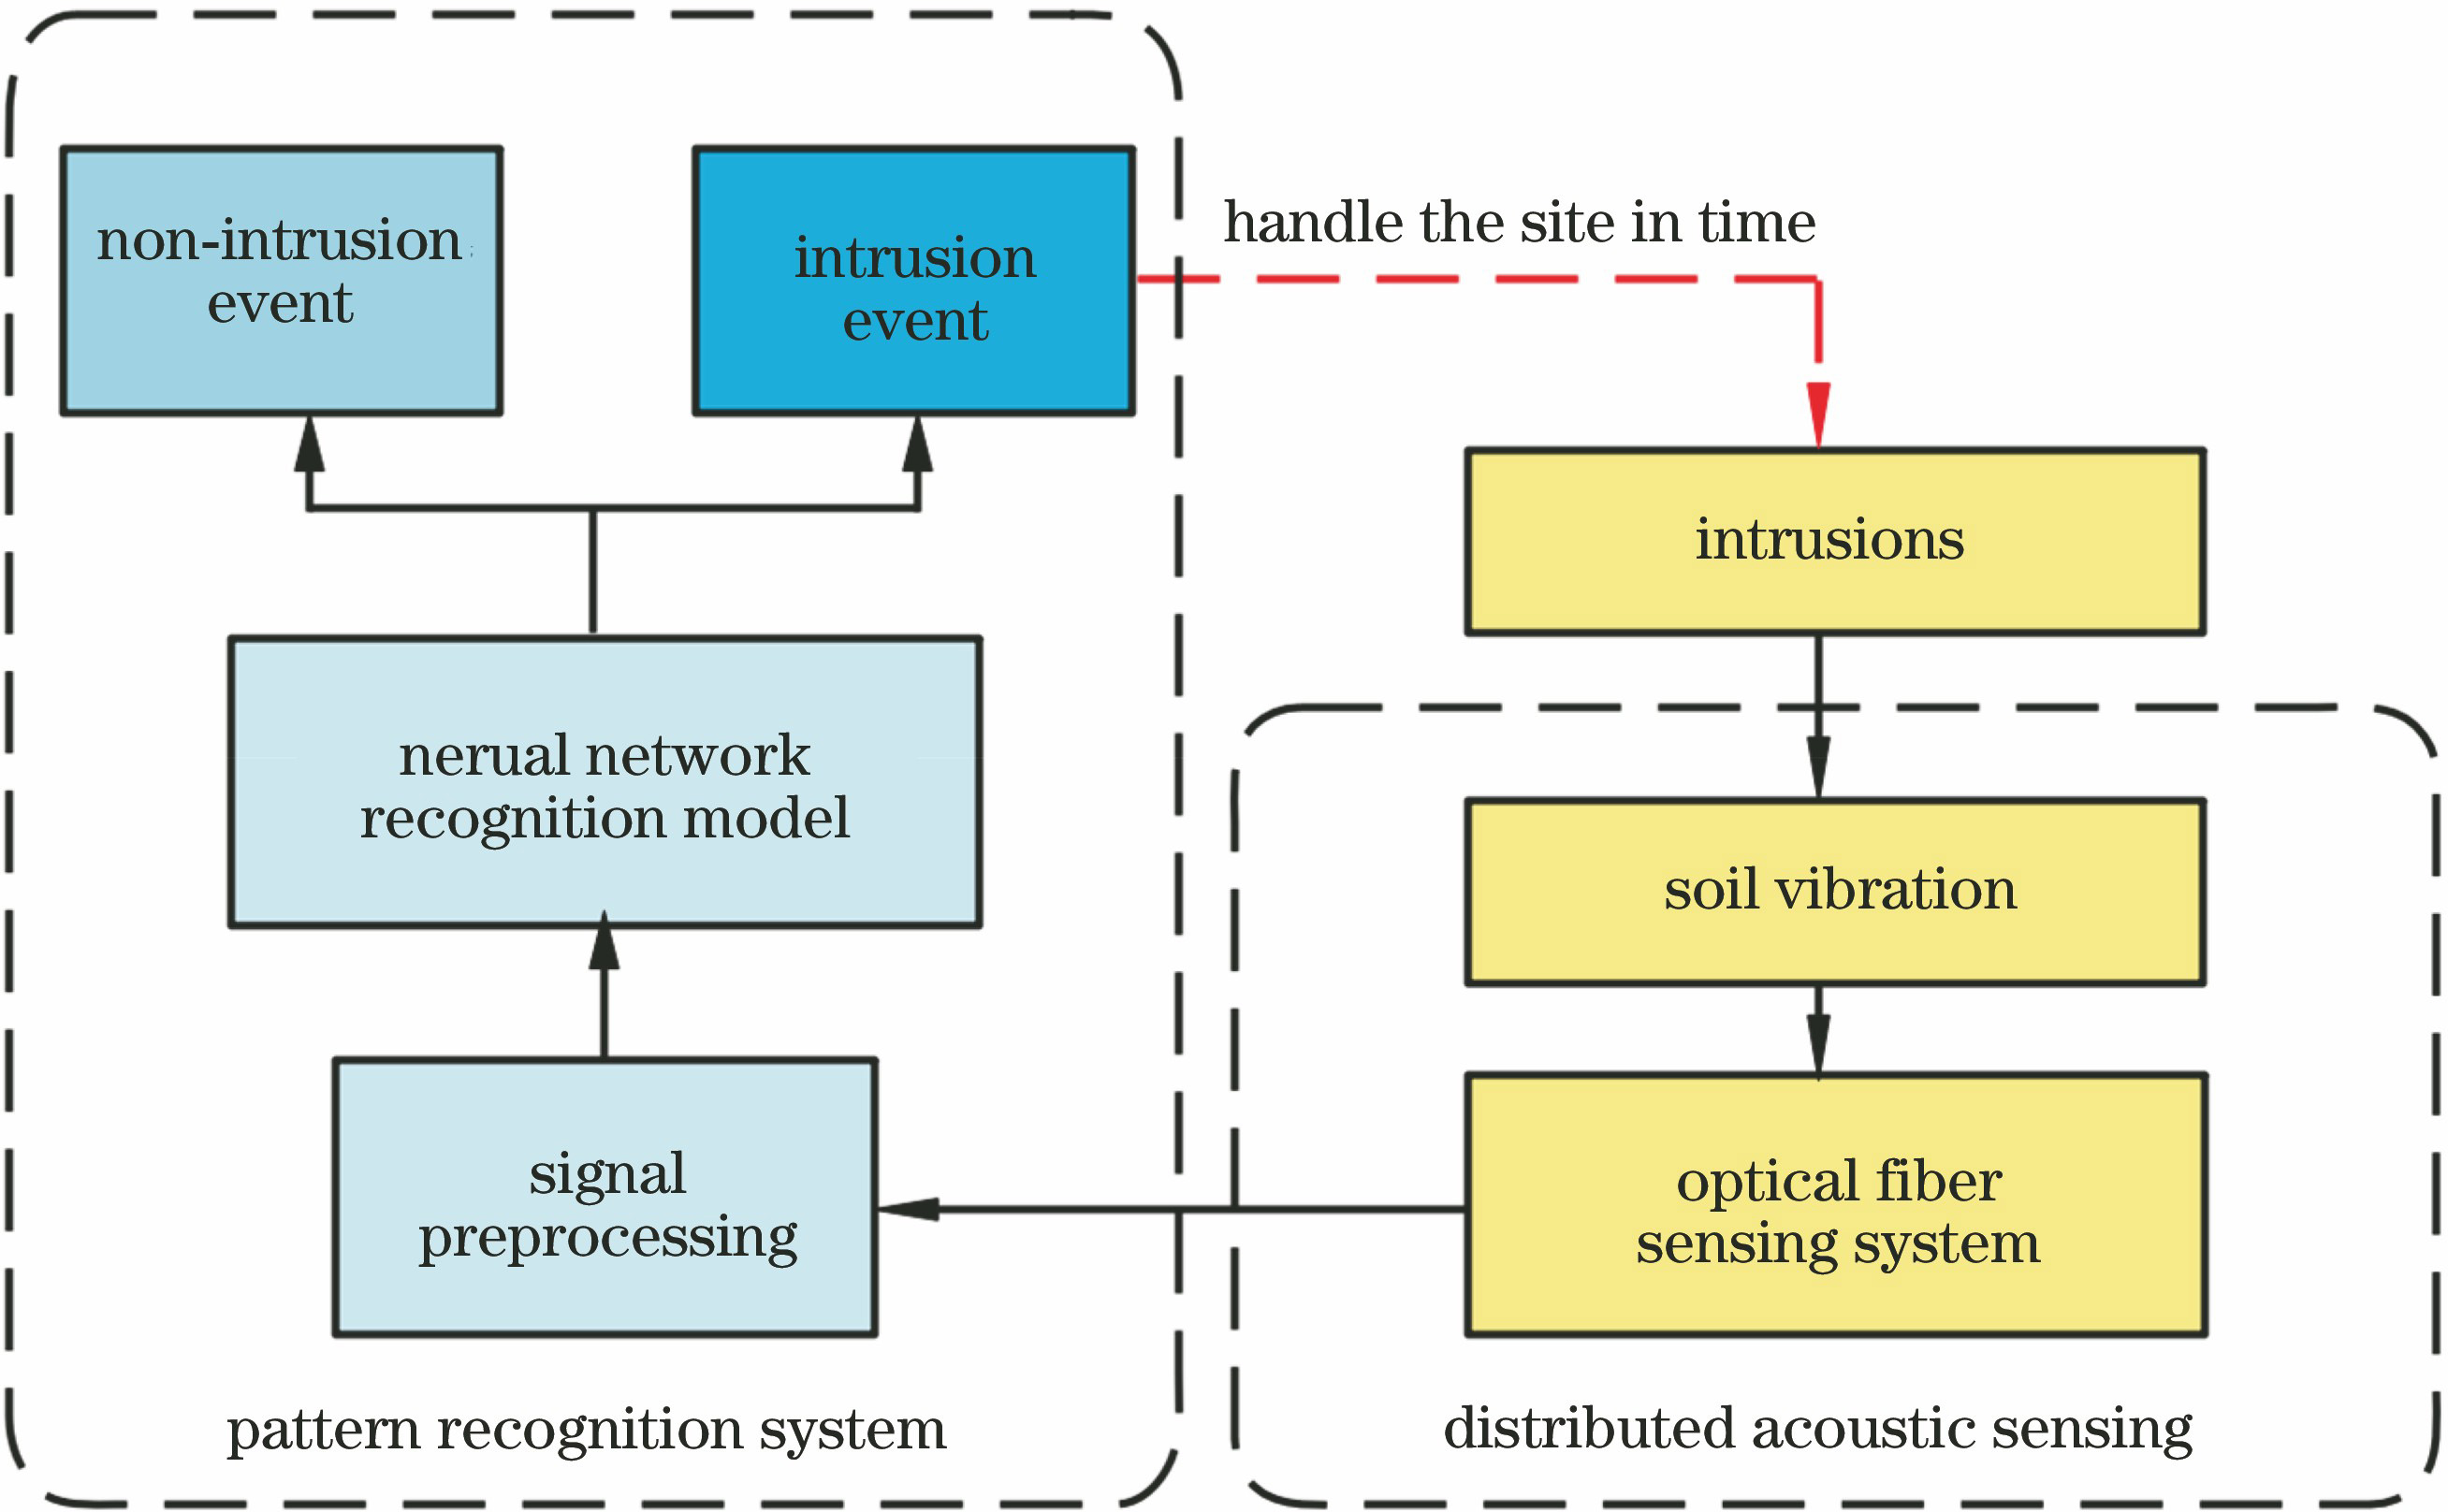
Fig. 1. Structure of long-distance optical fiber pre-warning system
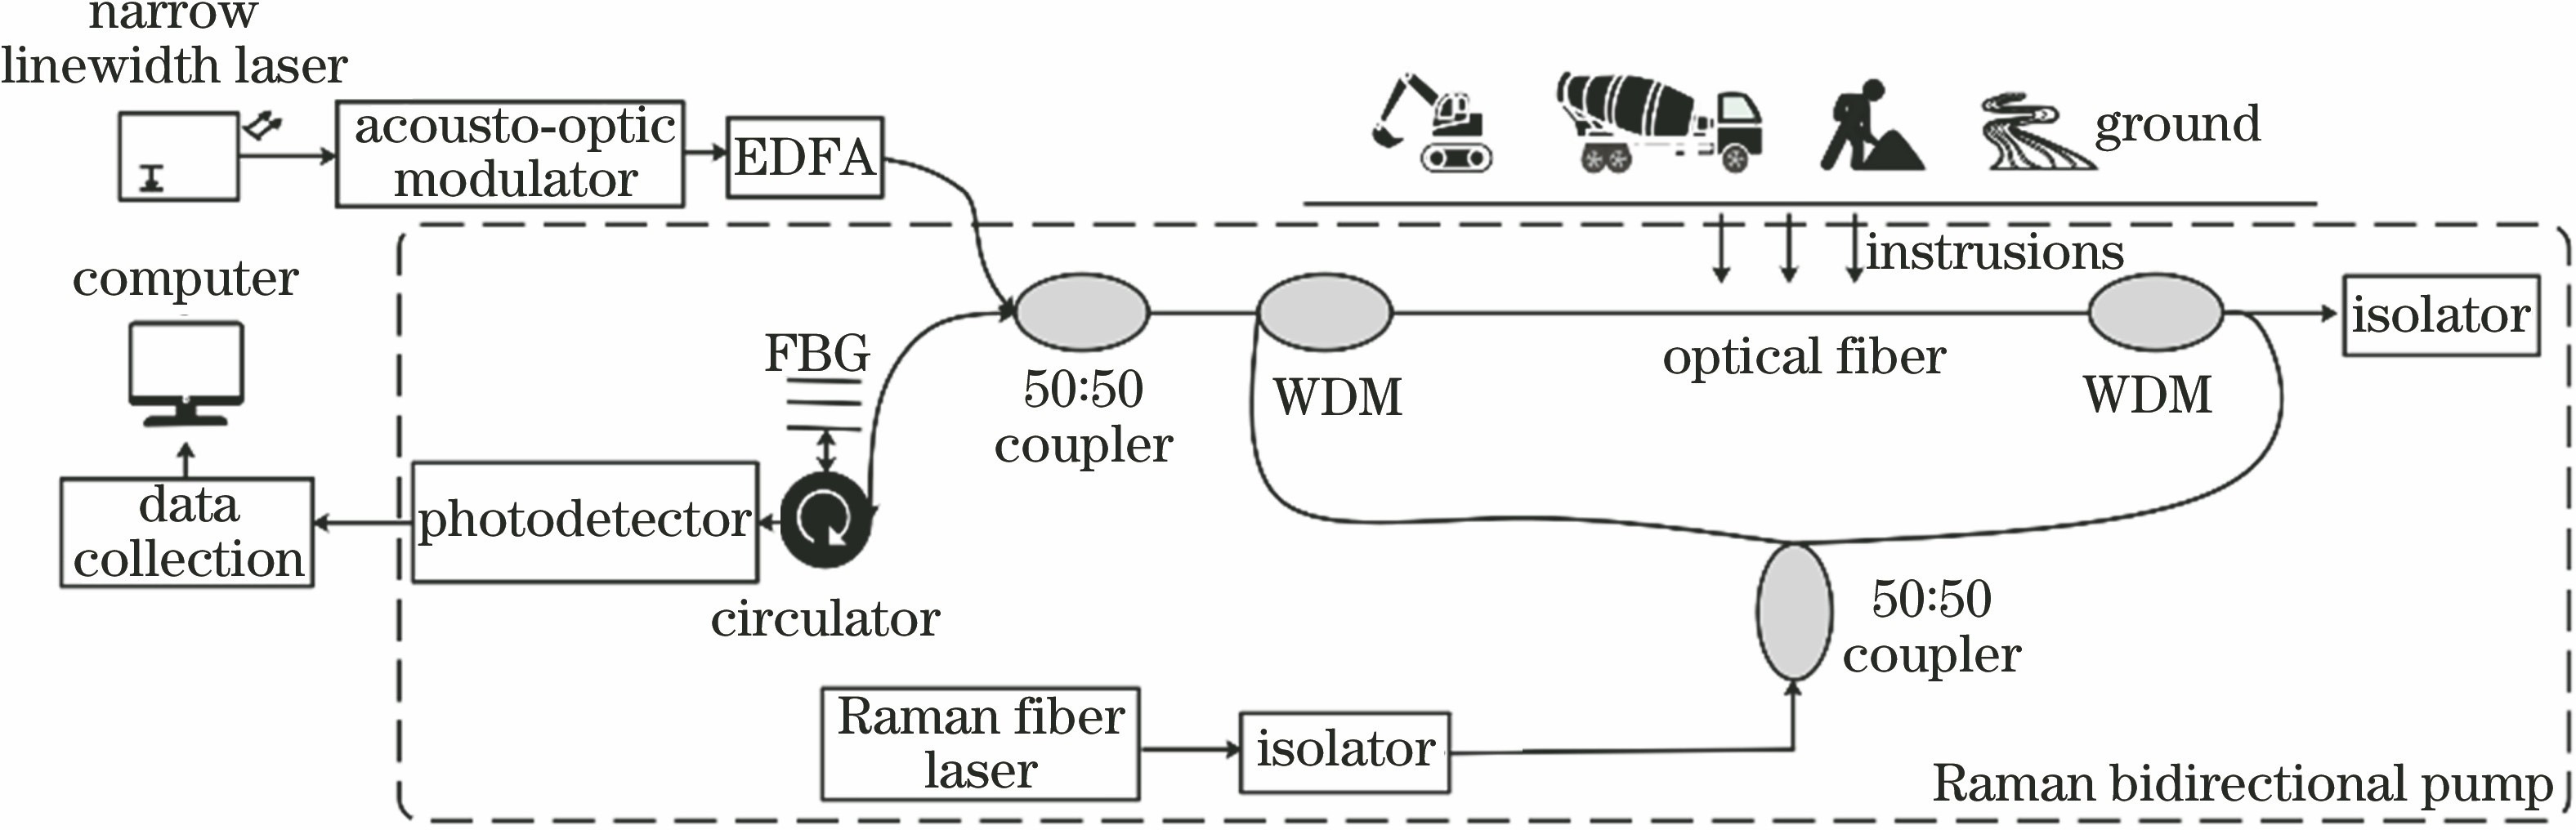
Fig. 2. Φ-OTDR vibration signal acquisition system
Fig. 3. Vibration event classification process
Fig. 4. Structure of the improved neural network
Fig. 5. Multi-scale decomposition tree of wavelet packet decomposition
Fig. 6. ANN network used for classification
Fig. 7. DNN network used for classification
Fig. 8. Three signal samples in Baoshan area of Shanghai. (a) NI event; (b) MG event; (c) ME event
Fig. 9. Comparison of signal samples before and after Max Abs Scaler. (a1)(a2) NI event; (b1)(b2) MG event; (c1)(c2) ME event
Fig. 10. Signal and its WPE distributions. (a)NI event; (b)MG event; (c) ME event
Fig. 11. Relationship between number of epoch and validation accuracy, training loss during training. (a) Validation accuracy; (b) training loss
Fig. 12. Comparison of occurrence probability of MD event in model recognition. (a) Before using the improved neural network; (b) after using the improved neural network
|
Table 1. The first experiment data
|
Table 2. Signal recognition accuracy of the first experimentunit:%
|
Table 3. The second experiment data
|
Table 4. Signal recognition accuracy of the second experimentunit:%
|
Table 5. Comparison of the recognition time of the three methods

Set citation alerts for the article
Please enter your email address
© Copyright 2018-2021 | Chinese Laser Press. All Rights Reserved 沪ICP备15018463号-20