• Photonics Research
  • Vol. 9, Issue 1, 81 (2021)
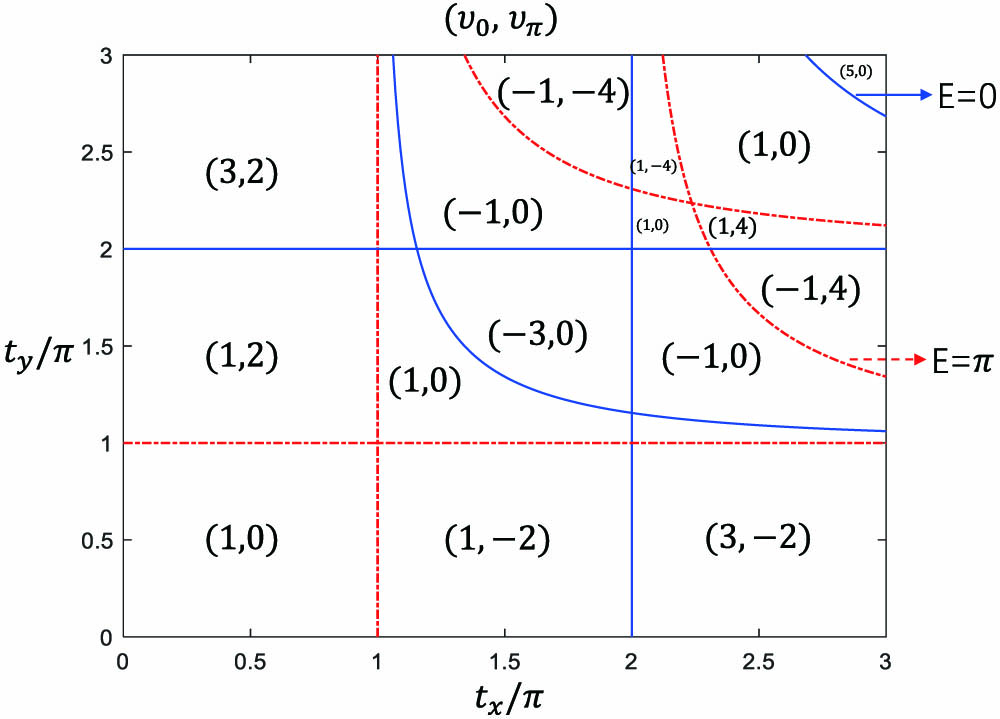
Bing Chen1、2, Shuo Li3, Xianfei Hou1, Feifei Ge1, Feifei Zhou1, Peng Qian1, Feng Mei4、5、7、*, Suotang Jia4、5, Nanyang Xu1、8、*, and Heng Shen2、6、9、*
Author Affiliations
  • 1School of Electronic Science and Applied Physics, Hefei University of Technology, Hefei 230009, China
  • 2State Key Laboratory of Quantum Optics and Quantum Optics Devices, Institute of Opto-Electronics, Shanxi University, Taiyuan 030006, China
  • 3Stanford Institute for Materials and Energy Sciences, Menlo Park, California 94025, USA
  • 4State Key Laboratory of Quantum Optics and Quantum Optics Devices, Institute of Laser Spectroscopy, Shanxi University, Taiyuan 030006, China
  • 5Collaborative Innovation Center of Extreme Optics, Shanxi University, Taiyuan 030006, China
  • 6Clarendon Laboratory, University of Oxford, Oxford OX1 3PU, UK
  • 7e-mail: meifeng@sxu.edu.cn
  • 8e-mail: nyxu@hfut.edu.cn
  • 9e-mail: hengshen@nbi.dk
  • show less
    DOI: 10.1364/PRJ.404163 Cite this Article Set citation alerts
    Bing Chen, Shuo Li, Xianfei Hou, Feifei Ge, Feifei Zhou, Peng Qian, Feng Mei, Suotang Jia, Nanyang Xu, Heng Shen. Digital quantum simulation of Floquet topological phases with a solid-state quantum simulator[J]. Photonics Research, 2021, 9(1): 81 Copy Citation Text show less
    Topological winding numbers (ν0, νπ) as a function of tx and ty. The red and blue solid lines separating different topological phases correspond to the gap closings at E=0 and E=π, respectively.
    Fig. 1. Topological winding numbers (ν0, νπ) as a function of tx and ty. The red and blue solid lines separating different topological phases correspond to the gap closings at E=0 and E=π, respectively.
    (a) Illustration of experiment schematics and atomic structure of the nitrogen-vacancy (NV) center in diamond. (b) Scheme of energy levels of the NV center electron spin. Both its ground state (A23) and excited state (E3) are spin triplets, and the transition between the two states corresponds to the zero-phonon line (ZPL) at 637 nm (1.945 eV). The ground state (A23) is a spin triplet with a zero-field splitting of 2.87 GHz between ms=0 and ms=±1 states. (c) Schematic of digital quantum simulation. The spin is prepared in the superposition state of ms=0 and ms=−1. The symbol of U represents N series of the Floquet operators U1 and U2 which are shown in detail in (d). Then, we measure the time evolution of the spin polarization ⟨σ^x,y⟩ represented by the meter. (e) The Ramsey oscillation of the electron spin coherence. The data were taken with the microwave detuning of 1.0 MHz by varying the temporal separation between the two microwave p/2 pulses. The Ramsey signal was fitted to exp[−(τ/T2*)2]cos(2πft) (blue line), where f values correspond to the microwave detuning, obtained T2*=2.59±0.14 μs. (f) Electron-spin Rabi oscillation driven by microwave. The length of π microwave pulse is 35.0 ns by fitting the Rabi oscillation signal.
    Fig. 2. (a) Illustration of experiment schematics and atomic structure of the nitrogen-vacancy (NV) center in diamond. (b) Scheme of energy levels of the NV center electron spin. Both its ground state (A23) and excited state (E3) are spin triplets, and the transition between the two states corresponds to the zero-phonon line (ZPL) at 637 nm (1.945 eV). The ground state (A23) is a spin triplet with a zero-field splitting of 2.87 GHz between ms=0 and ms=±1 states. (c) Schematic of digital quantum simulation. The spin is prepared in the superposition state of ms=0 and ms=1. The symbol of U represents N series of the Floquet operators U1 and U2 which are shown in detail in (d). Then, we measure the time evolution of the spin polarization σ^x,y represented by the meter. (e) The Ramsey oscillation of the electron spin coherence. The data were taken with the microwave detuning of 1.0 MHz by varying the temporal separation between the two microwave p/2 pulses. The Ramsey signal was fitted to exp[(τ/T2*)2]cos(2πft) (blue line), where f values correspond to the microwave detuning, obtained T2*=2.59±0.14  μs. (f) Electron-spin Rabi oscillation driven by microwave. The length of π microwave pulse is 35.0 ns by fitting the Rabi oscillation signal.
    Measurement of topological winding number (a) ν1 and (c) ν2 with tx=0.5π and ty=0.5π. (a) The experimentally observed time-averaged spin polarizations ⟨σ^x,y⟩‾ as a function of kx after N=10 times U^1. The associated theoretical result with repetition number N=60 is plotted in (b). (c) The experimentally observed time-averaged spin polarizations ⟨σ^x,y⟩‾ as a function of kx after N=10 times U^2. The associated theoretical results with repetition number N=60 is plotted in (d). Red dash-dotted and blue solid lines represent the theoretical results of σ^y and σ^x while the red circles and blue squares show the experimental values of σ^y and σ^x, respectively. Each data point has been averaged 5×10⁶ repetitions.
    Fig. 3. Measurement of topological winding number (a) ν1 and (c) ν2 with tx=0.5π and ty=0.5π. (a) The experimentally observed time-averaged spin polarizations σ^x,y as a function of kx after N=10 times U^1. The associated theoretical result with repetition number N=60 is plotted in (b). (c) The experimentally observed time-averaged spin polarizations σ^x,y as a function of kx after N=10 times U^2. The associated theoretical results with repetition number N=60 is plotted in (d). Red dash-dotted and blue solid lines represent the theoretical results of σ^y and σ^x while the red circles and blue squares show the experimental values of σ^y and σ^x, respectively. Each data point has been averaged 5×10⁶ repetitions.
    Measurement of topological winding number (a) ν1 and (c) ν2 with tx=2.5π and ty=0.5π. (a) The experimentally observed time-averaged spin polarizations ⟨σ^x,y⟩‾ as a function of kx after N=10 times U^1. The associated theoretical result with repetition number N=60 is plotted in (b). (c) The experimentally observed time-averaged spin polarizations ⟨σ^x,y⟩‾ as a function of kx after N=10 times U^2. The associated theoretical result with repetition number N=60 is plotted in (d). Red dash-dotted and blue solid lines represent theoretical results of σ^y and σ^x while the red circles and blue squares show the experimental values of σ^y and σ^x, respectively. Each data point has been averaged 5×10⁶ repetitions.
    Fig. 4. Measurement of topological winding number (a) ν1 and (c) ν2 with tx=2.5π and ty=0.5π. (a) The experimentally observed time-averaged spin polarizations σ^x,y as a function of kx after N=10 times U^1. The associated theoretical result with repetition number N=60 is plotted in (b). (c) The experimentally observed time-averaged spin polarizations σ^x,y as a function of kx after N=10 times U^2. The associated theoretical result with repetition number N=60 is plotted in (d). Red dash-dotted and blue solid lines represent theoretical results of σ^y and σ^x while the red circles and blue squares show the experimental values of σ^y and σ^x, respectively. Each data point has been averaged 5×10⁶ repetitions.
    Bing Chen, Shuo Li, Xianfei Hou, Feifei Ge, Feifei Zhou, Peng Qian, Feng Mei, Suotang Jia, Nanyang Xu, Heng Shen. Digital quantum simulation of Floquet topological phases with a solid-state quantum simulator[J]. Photonics Research, 2021, 9(1): 81
    Download Citation