• Laser & Optoelectronics Progress
  • Vol. 58, Issue 22, 2230002 (2021)
Kunshan Gu and Jifen Wang*
Author Affiliations
  • School of Investigation, People's Public Security University of China, Beijing 100038, China
  • show less
    DOI: 10.3788/LOP202158.2230002 Cite this Article Set citation alerts
    Kunshan Gu, Jifen Wang. Comparison of Paint Classification Methods Based on Spectral Fusion[J]. Laser & Optoelectronics Progress, 2021, 58(22): 2230002 Copy Citation Text show less
    Four infrared spectra of 50 paint samples. (a) Original spectra; (b) first derivative spectra; (c) second derivative spectra; (d) third derivative spectra
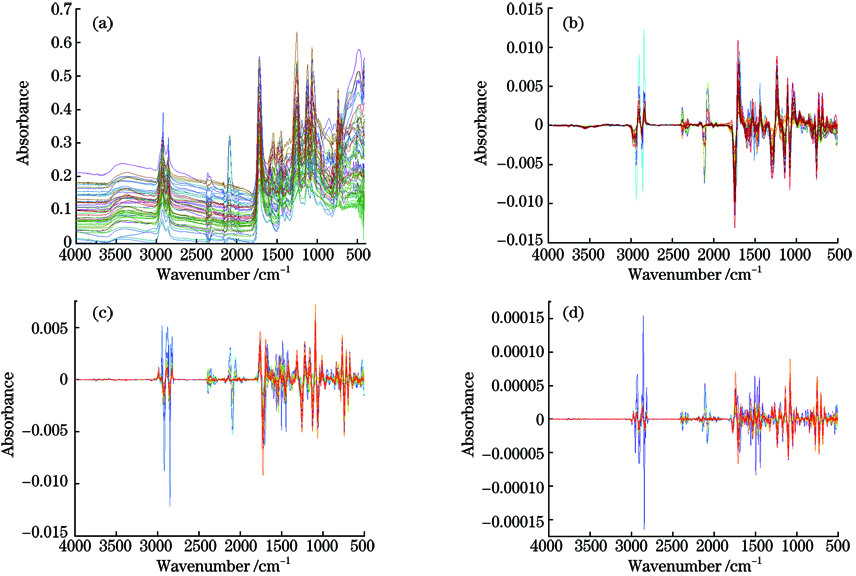
    Fig. 1. Four infrared spectra of 50 paint samples. (a) Original spectra; (b) first derivative spectra; (c) second derivative spectra; (d) third derivative spectra
    Effect of K value selection on error rate
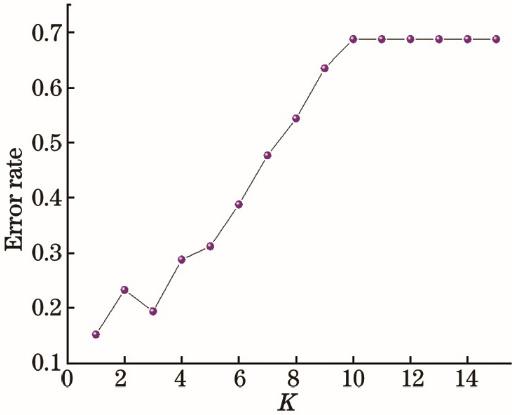
    Fig. 2. Effect of K value selection on error rate
    Overall classification and recognition rate of five paint samples under 10 spectral data models
    Fig. 3. Overall classification and recognition rate of five paint samples under 10 spectral data models
    Statistical results of minimum classification errors of four kernel functions
    Fig. 4. Statistical results of minimum classification errors of four kernel functions
    Recognition rate of paint samples from different spectral data sets by SVM
    Fig. 5. Recognition rate of paint samples from different spectral data sets by SVM
    The average classification and recognition rate of all kinds of samples by SVM
    Fig. 6. The average classification and recognition rate of all kinds of samples by SVM
    Discriminant analysis diagram
    Fig. 7. Discriminant analysis diagram
    Spectral typeAccuracy /%
    Y1Y2Y3Y4Y5
    Original spectra (OG)14100888414
    1st derivative spectra (FD)571001007414
    2nd derivative spectra (SD)571001008943
    3rd derivative spectra (TD)571001007429
    G1291001007914
    G2291001008929
    G3431001008429
    G4711001008943
    G5571001007929
    G6431001008429
    Average accuracy45.710098.882.527.3
    Table 1. Classification and recognition rate of paint samples for each spectral data when K=1
    Spectral typeAccuracy /%
    Wilks’ LambdaUnexplained varianceMahalanobis distanceSmallest F ratioRao’s V
    Training setTest setTraining setTest setTraining setTest setTraining setTest setTraining setTest set
    OG94789488948894869276
    FD908494909486100909272
    SD9690969010096100909084
    TD989098881009698949886
    G19488928610098100909272
    G29690969010096100909084
    G39888968810096100929886
    G490861009010096100949682
    G59684968898941001008880
    G69284968810098100969686
    Table 2. The recognition rate of training sets and test sets of five discriminant analysis models under different spectral data
    FunctionEigenvalueCanonical correlationTest of functionWilks’ LambdaP
    F190.0920.9941 through 40.0000.000
    F214.7070.9682 through 40.0020.000
    F311.2330.9583 through 40.0280.000
    F41.8760.80840.3480.001
    Table 3. Discriminant function characteristic table
    Kunshan Gu, Jifen Wang. Comparison of Paint Classification Methods Based on Spectral Fusion[J]. Laser & Optoelectronics Progress, 2021, 58(22): 2230002
    Download Citation