
Mingzhu Zhao, Yan Zhang, Yingyan Zhu. Research Progress of Early Disease Detection Technology Based on Infrared Thermography[J]. Laser & Optoelectronics Progress, 2021, 58(8): 0800002
- Laser & Optoelectronics Progress
- Vol. 58, Issue 8, 0800002 (2021)
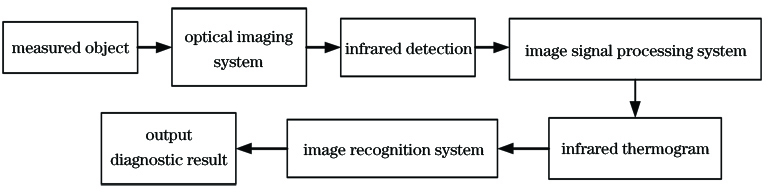
Fig. 1. Workflow of infrared thermal imaging detection system
![Infrared thermograms of breast masses[6]. (a)Patient with invasive ductal carcinoma; (b)patient with fibroadenoma; (c)patient with cyst](/richHtml/lop/2021/58/8/0800002/img_2.jpg)
Fig. 2. Infrared thermograms of breast masses[6]. (a)Patient with invasive ductal carcinoma; (b)patient with fibroadenoma; (c)patient with cyst
Fig. 3. Skin cancer detection algorithm block diagram
Fig. 4. Comparison of infrared thermograms of hands in patients with carpal tunnel syndrome[12].(a)Before operation; (b)after operation;(c)healthy volunteer
Fig. 5. Process of myocardial ischemic pre-diagnosis based on infrared imaging data[21]
Fig. 6. Infrared thermograms of face.(a)Patient with left-sided peripheral facial paralysis;(b)patient with central facial paralysis;(c)healthy volunteer
Fig. 7. Basic structure diagram of convolutional neural network
| |||||||||||||||||||||||||||||||||||||||||||||||||||||
Table 1. Comparison of mammography, ultrasonography, and far-infrared thermography in the diagnosis of breast lesions less than 2 cm in diameter (n=853)[18]
| |||||||||||||||||||||||||||||||||||||||||||||||||||||
Table 2. Comparison of mammography, ultrasonography, and far-infrared thermography in the diagnosis of breast lesions large than 2 cm in diameter (n=1193)[18]
|
Table 3. Comparison of breast cancer classification results based on differential thermal images

Set citation alerts for the article
Please enter your email address
© Copyright 2018-2021 | Chinese Laser Press. All Rights Reserved 沪ICP备15018463号-20