
Jianming CAI, Enpu MA, Jing LIN, Liuwen LIAO, Yan HAN. Exploring global food security pattern from the perspective of spatio-temporal evolution[J]. Journal of Geographical Sciences, 2020, 30(2): 179
- Journal of Geographical Sciences
- Vol. 30, Issue 2, 179 (2020)
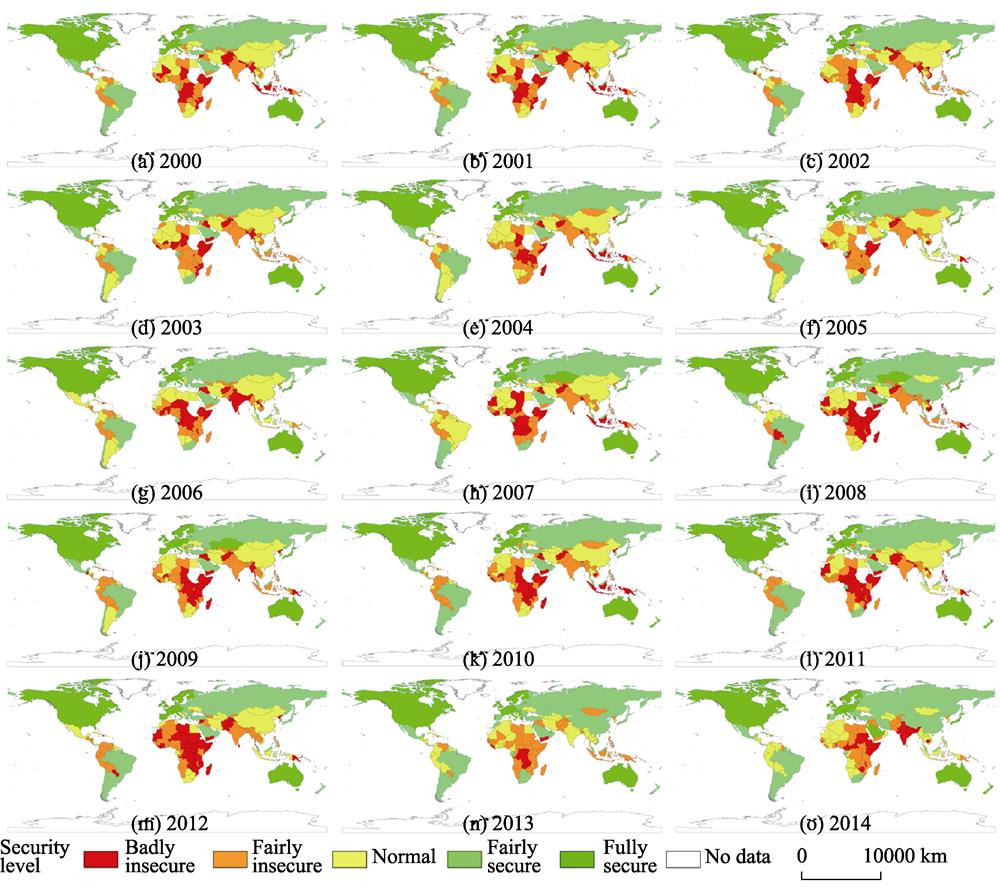
Fig. 1. Changes of the global food security pattern by country from 2000 to 2014
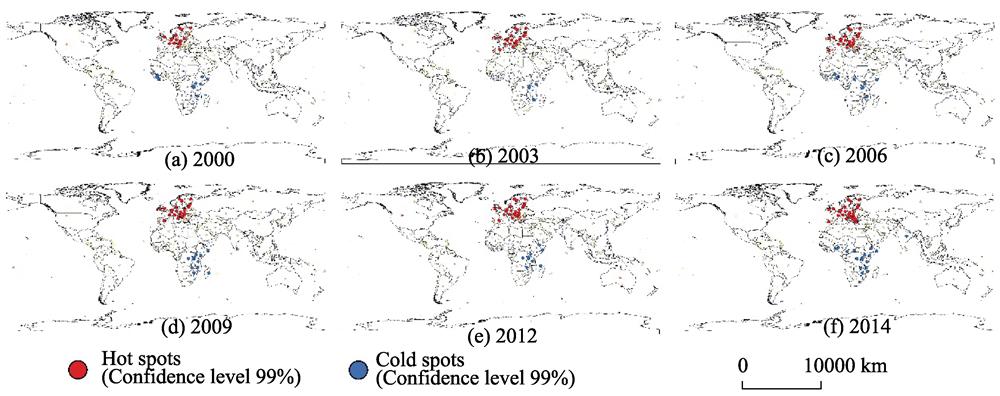
Fig. 2. Hot and cold spots of the global food security pattern from 2000 to 2014
|
Table 1.
Evaluation index system and measurement methods of food security
|
Table 2.
The selection of influencing factors of food security and data sources
| |||||||||||||||||||||||||||||||||||||||
Table 3.
Weight of each second layer variable
|
Table 4.
Moran’s I, z-score and P-value of the food security index from 2000 to 2014
|
Table 5.
Multi-linear regression equations served as control
|
Table 6.
Transformation equations
|
Table 7.
Multi-nonlinear regression equations
|
Table 8.
Influence coefficient of each factor

Set citation alerts for the article
Please enter your email address
© Copyright 2018-2021 | Chinese Laser Press. All Rights Reserved 沪ICP备15018463号-20