
Jianming CAI, Enpu MA, Jing LIN, Liuwen LIAO, Yan HAN. Exploring global food security pattern from the perspective of spatio-temporal evolution[J]. Journal of Geographical Sciences, 2020, 30(2): 179
- Journal of Geographical Sciences
- Vol. 30, Issue 2, 179 (2020)
Abstract
Keywords
1 Introduction
Food plays a decisive role in sustaining life and stabilizing the whole society. The issue of food security therefore, has always been the focus of many UN Framework documents and international scientific research programs. In the year 2000, when the United Nations proposed the Millennium Development Goals (MDGs), the first and the most prominent goal was “to halve, by the year 2015, the proportion of people who suffer from hunger.” Following that, in its 2030 Agenda for Sustainable Development, United Nations took the aim further “to end hunger, achieve food security and improved nutrition, and promote sustainable agriculture”. In May 2016, several resolutions closely related to food security such as food waste, biodiversity preservation, land degradation and desertification have also been officially put forward in the Second United Nations Environment Assembly Congress (
A series of global programs on food security thus have been initiated and launched worldwide. In the field of Earth System Sciences, the Joint Program of the Earth System Science Partnership focuses on four major topics: food, carbon, water and human security. The “Future Earth” Program was officially kicked off at the Rio Summit in 2012, which mainly analyzed the mechanism of the impact of global climate change on food, water and biodiversity, and provided scientific measures for ensuring adequate food for human development against the global environmental change (
The reason for ever increasing attentions to food security issues by the United Nations and International Council for Science, was not only that the food security has played a fundamental role in supporting the global sustainability, but also the failure of achieving the Sustainable Development Goals (SDGs) was becoming political pressure and a practical but humiliating challenge to mankind. The food crisis induced by the high surge in food price in 2008 and the severe drought in the Horn of Africa in 2011, made 57 countries monitored by Food and Agriculture Organization (FAO) fail to achieve the MDG of halving the proportion of chronically hungry people in the world. The estimated number of people with chronic malnutrition in the world in fact increased to 815 million in 2016, up from 777 million in 2015. Although the rate of stunting fell from 29.5% to 22.9% between 2005 and 2016, there were 155 million children under the age of five across the world still suffering from stunted growth. In 2016, wasting food affected the lives of 52 million children under the age of five, while almost 41 million children under five were overweight (FAO et al., 2017).
The recent rebounding in the number of chronically undernourished people may indicate that the situation of global food security has not been improved (FAO et al., 2017). In this context, we attempt to reveal the global food security pattern from the perspective of spatio-temporal evolution and the influencing factors behind, in an aim to identifying countries of high risk in food security, and the key areas and breakthroughs for enhancing future food security. Meanwhile, this study will also provide scientific basis for policy formation and recommendations for the realization of SDGs.
2 Definition of food security and the evaluation
The concept of “Food Security” proposed by FAO in 1974 was that “all people can get enough food for the need of survival and health at all times”. In 1983, the definition was updated to “that all people have both physical and economic access to the basic food that they need at all times” (
Due to the poor data availability and different policy background in many countries, it is always a big challenge to conduct global food security evaluation (
Based on the per capita GDP and food,
Existing studies on food security assessment mainly focus on a single factor or on national/regional levels. The comprehensive evaluations at the global level are still insufficient. A number of key questions still have to be answered: what changes have taken place in the pattern of global food security since the beginning of the 21st century? What factors influence these changes? What policies need to be adopted accordingly?
Food security is a comprehensive system influenced by many variables such as land, soil, water, climate change, level of agricultural technology, regional accessibility, the purchasing power of residents, food quality, and political and socio-economic stability. In order to provide more effective solutions to tackle the global food security challenge, a comprehensive evaluation and analysis are essential on the influencing factors of food security pattern. Therefore, this study will try to explore the evolutionary process of the global food security pattern and analyze the influencing factors of food security pattern from a comprehensive perspective based on the food security framework and the concept proposed and updated by FAO.
3 Materials and methods
3.1 Data
The basic unit of this analysis is country level. Two datasets for assessing global food security pattern and its influencing factors are established respectively. The assessing index is constructed based on FAO Food Security Framework including those indirect factors such as per capita GDP, political stability and non-violence levels. The details of the index system structure, data source, evaluation unit and year selection of the datasets are as follows.
3.1.1 The datasets for assessing food security
The latest definition of “food security” by FAO consists of four aspects including food supply, accessibility, utilization and stability securities (
Food supply and availability is the most necessary condition for food security, while people’s accessibility to the food is equally important. Besides the utilization of food, including the ways of cooking and storage, dietary habits, rational and effective use of nutrients in affordable food are also necessary conditions for ensuring food security. The country’s economic and political stability are used to measure the long-term influence of uncertain factors on food security. By considering the four factors, more detailed second tier indicators for constituting a food security evaluation index system are extracted from the FAOSTAT database. Then by removing the incomplete and discontinuous data, a final dataset that include 172 countries from 2000 to 2014 is deployed for assessing global food security as shown in
| Overall index | First layer factors | Second layer indicators | +/- influence | Measurement methods |
|---|---|---|---|---|
| Food security index | Food supply | X1: per capita food production (kg/person) | +(1) | X1 = total grain production/total population |
| X2: per capita protein supply (g/person*day) | + | X2 = supply of food protein/total population * days of the year | ||
| X3: per capita animal protein supply (g/person*day) | + | X3 = animal protein supply/total population * days of the year | ||
| X4: rate of dietary energy supply (%) | + | X4 = population with daily dietary energy greater than 2320 kcal(2)/total population | ||
| Food access | X5: food deficiency (kcal/person/day) | - | X5 = 2320 - daily per capita dietary energy taken by malnourished populations | |
| X6: per capita GDP (2011- dollar value) | + | X6 = gross domestic product converted by purchasing power parity/total population | ||
| Food utilization | X7: the proportion of short children under 5 (%) | - | X7 = number of short children under 5/number of children under 5 | |
| X8: the proportion of wasted children under 5 (%) | - | X8 = number of wasted children under 5/number of children under 5 | ||
| X9: proportion of population with access to clean water ( % ) | + | X9 = population with clean water/total population | ||
| Economic and political stability | X10: variability in food production per capita | - | X10 = standard deviation of per capita food production/average of per capita food production | |
| X11: variability of food supply per capita(kcal/person/day) | - | X11 = standard deviation of per capita food supply | ||
| X12: political stability and non-violence level | + | X12: World Governance Indicators Developed by the World Bank (WGI)(3) |
Table 1.
Evaluation index system and measurement methods of food security
3.1.2 Database for exploring the influencing factors of food security
Many factors will affect food security. The existing literature mainly studied the influencing factors of food security from the perspective of single factor or multi-factors, such as land degradation (
| Influencing factors | Methods and data | Data resource websites |
|---|---|---|
| Z1: per capita arable land area (ha/person) | Z1 = arable land area/total population | http://www.fao.org/faostat/en/ |
| Z2: per capita renewable water resources (m3/person) | Z2 = renewable water resources/total population | renewable water resource:http://chartsbin.com/view/1469;population:http://www.fao.org/faostat/en/ |
| Z3: annual precipitation (mm) | Z3: provided by the climate research unit at the University of East Anglia | https://crudata.uea.ac.uk/cru/data/hrg/cru_ts_3.23/crucy.1506241137.v3.23/countries/pre/ |
| Z4: annual average temperature (℃) | Z4: provided by the climate research unit at the University of East Anglia | https://crudata.uea.ac.uk/cru/data/hrg/cru_ts_3.23/crucy.1506241137.v3.23/countries/tmp/ |
| Z5: coordination degree of land and water | Z5 = renewable water/arable land area | renewable water resource:http://chartsbin.com/view/1469;arable land area:http://www.fao.org/faostat/en/ |
| Z6: chemical fertilizer applied per unit land area (kg/ha) | Z6 = applied chemical fertilizers/arable land area | http://www.fao.org/faostat/en/ |
| Z7: CO2 emissions (kt) | Z7: from the National Greenhouse Gas Emission Dataset of the World Resources Institute. This dataset is a combination of data from Oak Ridge National Laboratory, FAO, International Energy Agency, World Bank, and Environmental Protection Agency. | http://datasets.wri.org/dataset/cait-country |
| Z8: per capita GDP (dollar value in 2011) | Z8 = GDP (dollar value in 2011)/total population | http://www.fao.org/faostat/en/ |
| Z9: the proportion of the population with access to clean water (%) | Z9 = population with access to clean water/total population | http://www.fao.org/faostat/en/ |
| Z10: political stability and non-violence level | Z10: World Governance Indicators Developed by the World Bank | https://datacatalog.worldbank.org/dataset/worldwide-governance-indicators |
Table 2.
The selection of influencing factors of food security and data sources
3.2 Methodology
Three methods and steps were employed in the study. Firstly, we used a multi-factor comprehensive evaluation method and radar map area model to assess the situation of food security in 172 countries from 2000 to 2014. Secondly, the spatial autocorrelation analysis was applied to study the evolution process and characteristics of the global food security pattern. Finally, a multivariate nonlinear regression analysis method was used to study the influencing factors of the food security pattern.
3.2.1 Multi-variable comprehensive evaluation method
A multi-variable comprehensive evaluation method can integrate multiple aspects of the collectable information to fully reflect the real status of food security. It has been widely used nowadays in multidisciplinary researches with the national or administrative area as the basic unit.
The general steps of multi-variable comprehensive evaluation method include the establishment of indexes systems, data preparation, determination of weighting point of each variable, the establishment of evaluation models, and manipulation. Determination of weight coefficient of each indicator is critical important for the assessment and the key for evaluation quality. Given our purpose is to analyze the global food security pattern at national level from 2000 to 2014, the weight coefficient has to reflect the degree of relative dispersion of the selected indicators. The greater the indicator weight is, the higher degree of its relative discrepancies, the greater the role of the indicator will be in the formation of the disparity of the food security pattern. Given the popularity of the Mean Square Error (MSE) in statistical model in measuring the disparity of variables, this study will then use MSE method to determine the weight coefficient of each indictor.
3.2.2 Radar map area model
Radar map area models are often used to visually express the distribution of indicators with the same magnitude and dimension to express the normalized results of multi-variable values in a comprehensive evaluation. Although there is still controversy over whether the area of the radar map is meaningful or not, yet compared to the multi-variable comprehensive evaluation method, the radar map area models have its many advantages, such as they can reflect the nonlinear relationship between indicators and also the closed transfer relationship between evaluation indicators and the target layer.
Based on the discussion above on food security, it can be seen that food availability/supply, food accessibility, food affordability/utilization, economic and political stability constitute a comprehensive closed transfer relationship of food security, in which a linear weighted model cannot fully reflect it. Thus, based on the results of the evaluation of the first layer indictors, the radar area method was used to calculate the national food security index. If Y1, Y2, Y3, and Y4 respectively represent the evaluation value of the food supply, food accessibility, food utilization, economic and political stability, and FSI represents the overall food security index, the radar map area model can be expressed as FSI=(Y1·Y2+Y2·Y3+Y3·Y4+Y4·Y1)/2.
3.2.3 Spatial autocorrelation analysis
Spatial autocorrelation analysis is a method to measure the spatial interdependence of geographic phenomena. Usually spatial autocorrelation method includes the analysis of Moran’s I, Geary’s C, Getis, and Join Count. In this study, ArcGIS 10.2 will be applied to analyze the spatial autocorrelation of the food security indicators, and the Moran’s I index will be used to determine the distribution characteristics of the food security indicators.
3.2.4 Multivariate nonlinear regression analysis method
Multiple regression analysis is a widely used method to analyze the relationship between a specified dependent variable and multiple independent variables by establishing a linear or nonlinear mathematical model with a satisfied statistical testing. Given that there is a nonlinear relationship between the food security index and per capita GDP, population with accessing to clean water, degree of political stability and non-violence, a multi-nonlinear regression analysis on the influencing factors of food security pattern thus was employed and conducted in this study with the help of SPSS 20.0 following the steps: (1) Stepwise regression analysis: taking the food security index as dependent variable and the food security influencing factors as independent variables, the influencing factors based on the significance test with F-test ≤ 0.05, and the multi-linear regression equations were established as a control; (2) Estimation of univariate curves: taking the food security index as dependent variable, the influencing factors selected in step (1) were estimated by the curves separately. All nonlinear models except “linear” and “Logistic” were selected, and the best curve estimation equations were determined based on the regression coefficient R2; (3) On the basis of the univariate curve estimation equations, the conversion variable T was introduced; and the normalized value of the independent variable (i.e. the value of influencing factor) was substituted into the univariate curve estimation equation to calculate Yi, j (I = 1, 2, …, 133; j=1, 2, …, m), and assign Yij to T, so that the food security index and each transformation variable T had a linear relationship; (4) Multi-linear regression: taking the food security index as dependent variable and conversion variable T as independent variable, the “entry” method to perform multi-linear regression again was adopted, and the coefficients of each transformation variable T were determined, and thus the conversion equations were established; (5) Establishing multi-nonlinear regression equations: the expressions of the transformation variables T (i.e., curve estimation equations) were substituted into the conversion equations to obtain multi-nonlinear regression equations, and thus the influencing level of each factor on the food security was obtained.
4 Data analysis and results
4.1 Evaluation of food security
The food security evaluation was conducted through the process of data standardization, weight coefficient determination, the establishment of a secondary index evaluation model, establishment of a radar map area model, and manipulation analysis.
4.1.1 Evaluation of food security
Since the indicators in the food security evaluation index system cannot be directly comparable due to the different measurement units in the dimension and direction, each indicator then needs to be standardized to eliminate the incomparability. The following range method to standardize the indicator was thus applied.
Positive indicators: $X_{ij}^{’}=(X_{ij}-minX_{ij})/(maxX_{ij}-minX_{ij})$;
Negative indicators: $X_{ij}^{’}=(maxX_{ij}-X_{ij})/(maxX_{ij}-minX_{ij})$,
where Xij is the original data of the j indicator of the i country (in alphabetical order); Xij´ is the corresponding standardized value; Xij´∈[0, 1]; max Xij is the maximum value of the j indicator; min Xij is the minimum value of the j indicator (i=1, 2, …, 172; j=1, 2, …, 12).
4.1.2 Weight determination based on mean-variance
The mean square method was deployed to determine the weight coefficient of each indicator. The analysis steps are as follows:
(1) Based on the standardized dataset, the standard deviation of each evaluation indicator was calculated for the years 2000 to 2014.
$\partial=\sqrt{\frac{\sum\limits_{i=1}^{n}(X_{ij}-\bar{X}_{ij})^{2}}{n}},i=1,2,\dots,172;j=1,2,\dots,12.$
(2) The weighting point for each variable in the second layer index that corresponded respectively to food supply, food access, food utilization, and stability of the economic and political system for years 2000 to 2014 was calculated by following formula:
$w_{mkj}=\frac{\partial_{mkj}}{\sum\limits_{k=1}^{K}\partial_{mkj}}$
where m represents the year 2000, 2001,..., 2014; k is the number of variables included in the first layer indicator, which are 1, 2, 3, and 4 respectively in this study for food supply, food accessibility, food utilization, and stability of economic and political system; and j is the number of the second layer variable, j=1, 2, ..., 12.
(3) The average weight point of each second layer variable was calculated as following for the years 2000 to 2014 as their uniform weight.
$w_{j}=\sum\limits_{m=2000}^{2014} w_{mkj}/15,k=4,2,3,3;j=1,2,\dots,12.$
The weight of each of second layer variable is listed in
| First layer indicators | Food supply | Food accessibility | Food utilization | Stability of the economic and political system | ||||||||
|---|---|---|---|---|---|---|---|---|---|---|---|---|
| Second layer variables | X1 | X2 | X3 | X4 | X5 | X6 | X7 | X8 | X9 | X10 | X11 | X12 |
| Weight | 0.21 | 0.28 | 0.33 | 0.18 | 0.51 | 0.49 | 0.39 | 0.31 | 0.3 | 0.27 | 0.31 | 0.42 |
Table 3.
Weight of each second layer variable
4.1.3 Evaluation of the first layer indicators
Based on the standardized datasets and weights of the second layer variables, the first layer indicator evaluation model was obtained as following to evaluate the food supply (Y1), food accessibility (Y2), food utilization (Y3), and economic and political stability (Y4) of each country from 2000 to 2014.
Y1=0.21X1+0.28X2+0.33X3+0.18X4
Y2=0.51X5+0.49X6
Y3=0.39X7+0.31X8+0.30X9
Y4=0.27X10+0.31X11+0.42X12
4.1.4 Food security index (FSI)
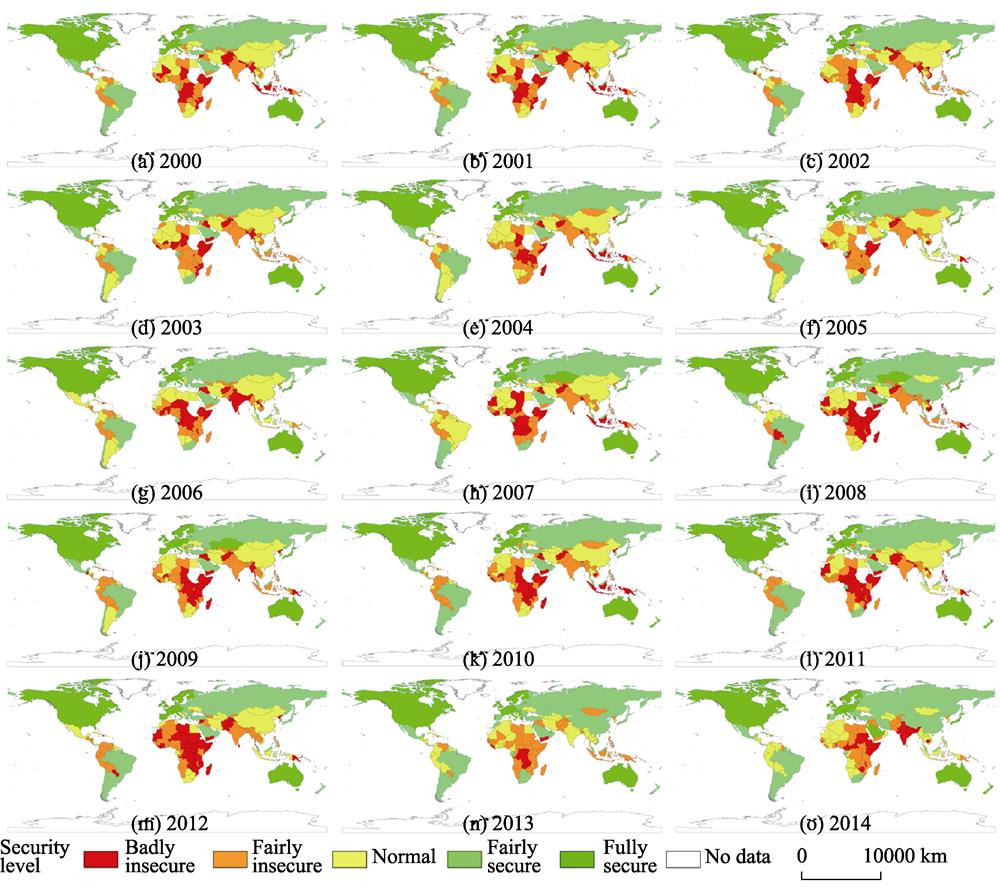
A radar map area model was established where FSI=(Y1Y2+Y2Y3+Y3Y4+Y4Y1)/2. Taking the evaluation results of the first layer indicators as inputs, we calculated the national food security index for the period 2000-2014. By ArcGIS 10.2, a natural discontinuous point grading method was adopted to classify the evaluation results into five categories, i.e: badly insecurity, fairly insecure, normal, fairly security and fully security. The results are shown in
![]()
Figure 1.
4.1.5 Analysis of food security pattern
The global food security pattern by country from 2000 to 2014 is very clear visually in
| Year | 2000 | 2001 | 2002 | 2003 | 2004 | 2005 | 2006 | 2007 | 2008 | 2009 | 2010 | 2011 | 2012 | 2013 | 2014 |
|---|---|---|---|---|---|---|---|---|---|---|---|---|---|---|---|
| Moran's I | 0.22 | 0.22 | 0.22 | 0.23 | 0.24 | 0.25 | 0.28 | 0.27 | 0.28 | 0.26 | 0.29 | 0.25 | 0.27 | 0.24 | 0.27 |
| z-score | 14.00 | 13.84 | 13.71 | 14.40 | 15.14 | 15.39 | 17.12 | 16.51 | 17.69 | 16.44 | 18.27 | 15.44 | 16.68 | 15.04 | 17.04 |
| P-score | 0 | 0 | 0 | 0 | 0 | 0 | 0 | 0 | 0 | 0 | 0 | 0 | 0 | 0 | 0 |
Table 4.
Moran’s I, z-score and P-value of the food security index from 2000 to 2014
The Moran’s I (>0) and P (=0) values in
Europe and sub-Saharan Africa are respectively high-high and low-low aggregation areas of the global food security index. Among the top 20 countries with the highest food security index in the world, the European countries account for more than 70%; while among the bottom 20 countries with the lowest food security index, the sub-Saharan African countries account for more than 50%. This results in hot spots and cold spots in the global food security landscape (
![]()
Figure 2.
The overall global food security pattern is relatively stable, but the changes in the badly insecurity and fairly security categories are relatively obvious. The annual change rate by mean value of the FSI indicates the dynamic fluctuation degree of it in each country. By descending order, the top 20 countries with the highest fluctuation degree were mainly in those countries with long-term food insecurity (except for Kuwait), low and volatile food security indexes, including Congo (Brazzaville), Somalia, Papua New Guinea, East Timor, Sierra Leone, Yemen, Ethiopia, Burundi, Cambodia, Mozambique, Nigeria and Syria. Although generally the overall global food security situation is gradually improving, yet at the same time, it still faces many challenges such as unstable volatility and serious food security problem in some regions.
4.2 Influencing factors of food security pattern
To explore the influencing factors of global food security pattern, a multi-nonlinear regression analysis was applied in this study detailed as follows:
4.2.1 Stepwise regression analysis
Taking the food security index as dependent variables and the influencing factors as independent variables, a stepwise regression analysis was conducted with SPSS 20.0. According to the significant F-test, the probability of less than 0.05 was decided as the entry criterion for the influencing factors, while the probability of greater than 0.10 was chosen as the deletion criterion. Meanwhile, multi-linear regression equations were established as controls.
The results showed that, among the influencing factors collected in advance, only the annual precipitation (Z3), annual average temperature (Z4), average chemical fertilizer application (Z6), per capita gross domestic product (Z8), proportion of people who have access to clean water (Z9), and the political stability and non-violence levels (Z10) entered the regression model. The multi-linear regression equations are shown in
| Year | Multi-linear regression equations | R2 | F | Sig. |
|---|---|---|---|---|
| 2002 | FSI=0.26-0.14Z4+0.60Z8+0.42Z9+0.39Z10 | 0.78 | 114.45 | 0.00 |
| 2003 | FSI=0.22-0.19Z4+0.61Z8+0.49Z9+0.37Z10 | 0.79 | 118.01 | 0.00 |
| 2004 | FSI=0.19-0.19Z4+0.56Z8+0.52Z9+0.39Z10 | 0.78 | 110.60 | 0.00 |
| 2005 | FSI=0.06-0.17Z4+0.51Z8+0.62Z9+0.43Z10 | 0.79 | 117.77 | 0.00 |
| 2006 | FSI=0.31+0.14Z3-0.32Z4+0.71Z8+0.43Z9+0.33Z10 | 0.83 | 124.08 | 0.00 |
| 2007 | FSI=0.20-0.17Z4-0.36Z6+0.70Z8+0.55Z9+0.34Z10 | 0.83 | 121.30 | 0.00 |
| 2008 | FSI=0.32-0.24Z4+0.68Z8+0.47Z9+0.28Z10 | 0.82 | 147.35 | 0.00 |
| 2009 | FSI=0.31+0.11Z3-0.24Z4-0.18Z6+0.76Z8+0.44Z9+0.28Z10 | 0.83 | 102.51 | 0.00 |
| 2010 | FSI=0.26-0.16Z4-0.45Z6+0.86Z8+0.48Z9+0.24Z10 | 0.83 | 124.83 | 0.00 |
| 2011 | FSI=0.009-0.10Z4-0.64Z6+0.82Z8+0.61Z9+0.36Z10 | 0.86 | 153.29 | 0.00 |
| 2012 | FSI=0.23-0.10Z4-0.59Z6+0.83Z8+0.40Z9+0.31Z10 | 0.86 | 152.71 | 0.00 |
| 2013 | FSI=0.28-0.10Z4+0.35Z8+0.31Z9+0.25Z10 | 0.69 | 70.32 | 0.00 |
| 2014 | FSI=0.25-0.12Z4+0.39Z8+0.36Z9+0.28Z10 | 0.72 | 80.87 | 0.00 |
Table 5.
Multi-linear regression equations served as control
In general, the independent variable in the multi-linear regression equation can reflect the direction and intensity of each influencing factor on food security. However, this study found that per capita GDP, proportion of people who have access to clean water, political stability and non-violence levels have a more significant nonlinear relationship with the food security index in most years, indicating that the linear regression method might have problems in analyzing the real relationship between food security and various influencing factors. To improve the accuracy of the results, we further compared the results of multi-nonlinear regression analysis with the results of the linear regression and chose the preferred one. Because SPSS 20.0 cannot directly perform the multi-nonlinear regression analysis, it needs to be implemented through variable substitution.
4.2.2 Nonlinear variable substitution
Nonlinear variable substitution is mainly achieved through univariate curve estimation and conversion variable assignment. Firstly, the univariate curves were estimated. In SPSS 20.0, food security indexes were used as dependent variables, and curves of the influencing factors selected in the previous step were estimated. All nonlinear models except “Linear” and “Logistic” were selected during the operation, and the best curve estimation equation was chosen based on the regression coefficient of determination, R2. When the R2 value of two or more curve estimation equations was very close, the simplest form of the equation was selected. Secondly, the conversion variable assignment was performed. Then, substitution of the normalized influencing factors into univariate curve estimation equations was done to obtain Yij (i = 1, 2, ..., 133; j = 1, 2, ..., m; m is the number of independent variables entering the regression equation of each period, m = 4, 5, 6). The conversion variable T was introduced and the value of Yij was assigned to T. Finally, there was a linear relationship between the conversion variable T and the food security indexes, and the coefficient of T could be further determined by multi-linear regression analysis which laid the foundation for the final establishment of multivariate nonlinear regression equations.
4.2.3 Multi-nonlinear regression analysis
The establishment of the multivariate nonlinear regression equations also took two steps. Firstly, the multi-linear regression was conducted. With the food security indexes as dependent variable and the conversion variable T as the independent variable, multi-linear regression was conducted again by the “enter” method. Then the coefficients of each conversion variable T were determined and a set of conversion equations were established (
| Year | Transformation equations | F | Sig. | |
|---|---|---|---|---|
| 2002 | FSI=-0.24+0.09T4+0.57T8+0.30T9+0.29T10 | 0.83 | 160.09 | 0.00 |
| 2003 | FSI=-0.23+0.10T4+0.55T8+0.35T9+0.30T10 | 0.83 | 157.89 | 0.00 |
| 2004 | FSI=-0.28+0.11T4+0.54T8+0.37T9+0.29T10 | 0.82 | 141.20 | 0.00 |
| 2005 | FSI=-0.23+0.06T4+0.47T8+0.42T9+0.33T10 | 0.82 | 146.46 | 0.00 |
| 2006 | FSI=-0.23-0.04T3+0.16T4+0.56T8+0.34T9+0.25T10 | 0.88 | 185.76 | 0.00 |
| 2007 | FSI=-0.22+0.14T4-0.03T6+0.53T8+0.37T9+0.28T10 | 0.84 | 129.99 | 0.00 |
| 2008 | FSI=0.20T4+0.64T8-0.03T9+0.28T10 | 0.85 | 186.05 | 0.00 |
| 2009 | FSI=-0.31+0.04T3+0.16T4-0.02T6+0.59T8+0.28T9+0.30T10 | 0.86 | 128.65 | 0.00 |
| 2010 | FSI=-0.29+0.15T4+0.04T6+0.60T8+0.30T9+0.23T10 | 0.86 | 160.09 | 0.00 |
| 2011 | FSI=-0.22+0.08T4-0.06T6+0.55T8+0.35T9+0.34T10 | 0.85 | 147.59 | 0.00 |
| 2012 | FSI=-0.24+0.10T4-0.001T6+0.60T8+0.26T9+0.33T10 | 0.87 | 162.64 | 0.00 |
| 2013 | FSI=-0.23+0.10T4+0.37T8+0.46T9+0.39T10 | 0.72 | 81.11 | 0.00 |
| 2014 | FSI=-0.24+0.09T4+0.52T8+0.34T9+0.37T10 | 0.77 | 106.88 | 0.00 |
Table 6.
Transformation equations
| Year | Multi-nonlinear regression equations |
|---|---|
| 2002 | FSI=0.30+0.27Z43-0.41Z42+0.12Z4-1.20Z82+1.52Z8+1.85Z93-2.83Z92+1.35Z9+0.20Z102+0.02Z10 |
| 2003 | FSI=0.31-0.06Z4-1.16Z82+1.47Z8+2.04Z93-2.98Z92+1.31Z9+0.19Z102+0.05Z10 |
| 2004 | FSI=0.28+0.03Z42-0.09Z4+0.25Z83-1.42Z82+1.47Z8+2.19Z93-3.32Z92+1.56Z9+0.11Z103+0.01Z102+0.12Z10 |
| 2005 | FSI=-0.06-0.04Z4-1.01Z82+1.26Z8+3.38Z93-5.54Z92+2.91Z9+0.20Z102+0.27Z10 |
| 2006 | FSI=0.34-0.13Z33+0.18Z32-0.05Z3-0.11Z4-1.18Z82+1.53Z8+2.65Z93-3.95Z92+1.7Z9+0.26Z103-0.17Z102+0.13Z10 |
| 2007 | FSI=0.39-0.09Z4-0.35Z63+0.49Z62-0.15Z6-0.96Z82+1.28Z8+2.40Z93-3.51Z92+1.50Z9+0.22Z102-0.01Z10 |
| 2008 | FSI=0.54-0.14Z4-1.22Z82+1.61Z8+0.30Z92-0.13Z9+0.21Z103-0.08Z102+0.11Z10 |
| 2009 | FSI=0.39+0.12Z33-0.17Z32+0.06Z3-0.11Z4-0.14Z63+0.20Z62-0.08Z6-1.14Z82+1.47Z8+2.13Z93-3.26Z92+1.46Z9 |
| 2010 | FSI=0.38+0.02Z42-0.12Z4+0.82Z63-1.07Z62+0.26Z6-1.18Z82+1.52Z8+2.47Z93-3.79Z92+1.69Z9+0.24Z103 |
| 2011 | FSI=-0.02-0.05Z4-3.32Z63+3.91Z62-0.61Z6-1.13Z82+1.45Z8+3.10Z93-5.10Z92+2.62Z9+0.45Z103-0.56Z102+0.47Z10 |
| 2012 | FSI=0.35-0.06Z4-0.06Z63+0.07Z62-0.01Z6-1.03Z82+1.39Z8+1.96Z93-3.01Z92+1.34Z9+0.33Z103-0.27Z102+0.23Z10 |
| 2013 | FSI=0.46-0.04Z4+0.32Z83-0.77Z82+0.63Z8+1.69Z93-2.21Z92+0.68Z9+0.29Z103-0.30Z102+0.24Z10 |
| 2014 | FSI=0.49-0.04Z4+0.97Z83-1.90Z82+1.24Z8+1.33Z93-1.70Z92+0.49Z9+0.29Z102-0.09Z10 |
Table 7.
Multi-nonlinear regression equations
Comparing
$f_{z_{i}}(Z_{i},Z_{j},Z_{p},Z_{q})=\mathop{lim}\limits_{\triangle Z_{i}\to 0}\frac{f_{Z_{i}}(Z_{i}+\triangle Z_{i}, Z_{j}, Z_{p}, Z_{q})-f_{Z_{i}}( Z_{i}, Z_{j}, Z_{p}, Z_{q})}{\triangle Z_{i}} $
where Zi, Zj, Zp and Zq represent the influencing factors that enter the regression model. Suppose ΔZi=1, the result is the influence coefficient of factor i on food security. Adopting this method, the partial derivative of FSI for each influencing factor in each year was calculated, and the influence coefficient of each factor was obtained as shown in
| Year | Annual precipitation | Annual | Chemical fertilizer applied per unit land area | Per capita GDP | Proportion of the population with | Political stability and non-violence level |
|---|---|---|---|---|---|---|
| 2002 | - | -0.0216 | - | 0.3192 | 0.372 | 0.2262 |
| 2003 | - | -0.057 | - | 0.319 | 0.378 | 0.243 |
| 2004 | - | -0.0682 | - | 0.297 | 0.4366 | 0.2436 |
| 2005 | - | -0.0354 | - | 0.2538 | 0.7518 | 0.4713 |
| 2006 | -0.0104 | -0.1104 | - | 0.3472 | 0.3978 | 0.22 |
| 2007 | - | -0.0924 | -0.0087 | 0.318 | 0.3885 | 0.2128 |
| 2008 | - | -0.138 | - | 0.384 | 0.1689 | 0.2324 |
| 2009 | 0.0048 | -0.1056 | -0.0066 | 0.3245 | 0.3276 | 0.252 |
| 2010 | - | -0.1005 | 0.012 | 0.336 | 0.363 | 0.1955 |
| 2011 | - | -0.10 | -0.64 | 0.82 | 0.61 | 0.36 |
| 2012 | - | -0.056 | -0.00029 | 0.354 | 0.2886 | 0.2871 |
| 2013 | - | -0.038 | - | 0.185 | 0.161 | 0.2379 |
| 2014 | - | -0.0378 | - | 0.312 | 0.1224 | 0.2035 |
Table 8.
Influence coefficient of each factor
4.2.4 Results and discussions
The per capita GDP on the purchasing power parity basis is used to measure the actual income and consumption levels of residents in different countries. This indicator reflects the level of food accessible capacity of the residents. The result indicates that for every increase of 10,000 US dollars in per capita GDP, the food security index increases by an average of 0.35. Countries with high per capita GDP have high food security, meaning the food accessible capacity of residents is indeed an important factor to enhance food security.
At the level of food utilization, the proportion of people who have access to clean water is positively correlated with food security. For every 1-unit increase in the standardized value, the food security index increases by an average of 0.37. From the perspective of consumers, water security is still an important foundation for food security. Water participates in the whole process of human metabolism, and it is also used during the food preparation and cooking. Therefore, clean water is the cornerstone of nutrition, while nutrition is the core of food security. At global level, health and sanitation, represented by clean drinking water, is one of the main factors affecting food security. According to statistics, globally, nearly 884 million people cannot access to clean drinking water, most of whom live in Africa. Among the bottom 20 countries with the lowest food security index, the average proportion of people with access to clean water is only 67.2% with the highest 86.6% (Iraq), and the lowest 40% (Papua New Guinea).
A stable economic and political environment is the guarantee for long-term food security. This study showed that there is a positive correlation between food security and political stability and non-violence level. For every 1-unit increase in the standardization of political stability and non-violence, the food security index increases by an average of 0.26. In recent years, the international and domestic conflicts have taken place from time to time. The number of domestic conflicts every year in the world is more than 23 and even up to 32 times; and non-state conflicts such as civil conflicts and terrorist incidents interfered by the foreign governments have also grown dramatically. From 2000 to 2016, the global average annual conflict was 146, with a minimum of 111 times and a maximum of 205 times. Violent conflicts have a very negative impact on the food security of volatile regions. Conflicts not only undermine the normal agricultural production, farmland, and agricultural infrastructure, but also impact the market expectations and cause sharp fluctuations in agricultural markets. Serious conflicts even can hinder the conduct of international food aid. From the year 2000 to now, of the 50 countries with the lowest food security index, except Mozambique and Zambia, the rest of the countries have a negative value of political stability and non-violence level. Thus it can be seen that higher economic and political stability is an important guarantee proxy for food security.
However, the impact of annual precipitation on the global food security pattern appears to be uncertain. Food insecurity areas do not coincide with the global desert arid zone. The results show that the North African region, which has the world’s largest desert, does not face severe food security problems; countries such as the United Arab Emirates, Oman, Qatar and Saudi Arabia are located in the arid desert zone, but their food security levels are fairly security or highly security; Australia, which has a large desert arid zone, ranks among the best in the food security index, and China, which also has a large arid and semi-arid zone, also has a medium-high level of food security. While the sub-Saharan Africa, which has a much better combination of light, hot and water resources, is a high-risk area for global food security. This is mainly because the comprehensive national strength and agricultural development level of sub-Saharan Africa has been at a low level for a long time, and the region is also affected by the overlapping effects of violent conflicts and climate change. The effect of the fertilizer application has the characteristics of “inverted U-shaped” pattern. For the least developed countries, increasing the application rate of chemical fertilizers can obviously increase the food supply quickly, but excessive fertilization is not conducive to crop production and will destroy long-term food security.
5 Conclusions and prospects
5.1 Conclusions
Three immediate conclusions can be drawn from this study as the following:
(1) The overall spatial pattern of the global food security pattern is high-high and low-low aggregation and this pattern is statistically significant. The high-high areas are mainly distributed in Europe (except Eastern Europe), North America, Oceania and parts of East Asia. The low-low areas are mainly distributed in sub-Saharan Africa, South and West Asia, and parts of Southeast Asia. Europe and sub-Saharan Africa are the hot and the cold spots in the global food security pattern, respectively.
(2) From 2000 to 2014, the global food security pattern was generally stable, but the internal changes of the badly insecurity and fairly insecurity categories were significant. While the global food security situation is gradually improving, it still faces the challenges of instability and regional food insecurity issues. Countries with the most volatile levels of food security are facing the most serious food security problems.
(3) The annual average temperature, per capita GDP, proportion of people who have access to clean water, political stability and non-violence levels are the main factors affecting the global food security pattern. While the impact of annual precipitation and fertilizer application are still uncertain in degree and scope. The lower explanatory power of annual average temperature and annual precipitation indicate that appropriate natural conditions cannot guarantee the food security by its own. In the global supply chain, factors such as the level of agricultural development, the purchasing power of the residents and regional accessibility have more direct positive impact.
5.2 Prospects
The Millennium Development Goal of halving the proportion of people who suffer from hunger by the year 2015 has not been achieved as expected, which poses more challenges to the expected goal of eliminating hunger by 2030. This requires world to reduce about 69.71 million hungry people annually in the coming 12 years for achieving this goal. Against this context, several suggestions could be made as references from this study.
(1) Building of the food security strategies based on the four pillars. At food supply aspect, considering the low purchasing power of the less developed countries, the practical strategies are to increase the self-sufficiency rate of food. This can be achieved by promoting agricultural development. The focuses should be on: the assessment of the potential of global arable land resources and the environmental impacts of their development and utilization, designing agricultural development models with multi-stakeholder benefit sharing mechanism with poverty alleviation as the core, and promotion and application of modern agricultural technologies. At the food accessibility dimension, the focus should be given to improving the availability of food, accessible capacity of the residents, transport infrastructure and a diverse regional food system. At the food utilization perspective, the focuses should be on the promotion of infrastructures such as clean drinking water in underdeveloped areas and the development of regional health food plans. At the economic and political stability aspect, the focuses should be on studying the mechanism of the impact of violent conflict on food security, and the strategies for resolving the conflicts.
(2) Promoting the food security construction by vitalizing the countryside. Given that three-quarters of the world’s hungry people live in the countryside, the countryside is clearly the focal attention of food security strive. Rural vitalization might be a long-term solution to effectively solve the food security problems in the countryside. At present, Chinese scholars have issued a call for “vitalizing the world’s countryside” and proposed many methods such as urbanization and adopting the “Bottom-up” approach for developing the rural priorities (
(3) Turning towards new production methods. Given that we are entering the urbanization era, and a quarter of the world’s hungry people are also located in urbanized areas. When the global population surges to 9.19 billion by 2050, the urban population will be as high as 6.4 billion, of which 83.28% will reside in developing countries. It is then badly necessary to switch to new production methods such as urban agriculture. Producing food in vertical farms using controlled environmental agricultural technology is increasingly becoming a realistic option for food security in urban regions.
References
[1] Y M An, W W Zhao. Global climate change and food security: Review of the 2012 planet under pressure international conference. Acta Ecologica Sinica, 32, 4940-4942(2012).
[2] B Andrea, E D Mauro, C Carlo. National food security assessment through the analysis of food consump-tion data from household consumption and expenditure surveys: The case of Brazil’s Pesquisa de OrçamentoFamiliares 2008/09. Food Policy, 72, 20-26(2017).
[4] J Beghin, B Meade, S Rosen. A food demand framework for international food security assessment. Journal of Policy Modeling, 39, 827-842(2017).
[5] The State of Food Insecurity in the World 2001. Rome, Italy: Food and Agriculture Organizationof the United Nations(2002).
[6] et alThe State of Food Security and Nutrition in the World 2017: Enhancing Resilience and Promoting Peace and Food Security. Rome, Italy: Food and Agriculture Organization of the United Nations, 4(2017).
[7] Future Earth Initial Design. Paris: International Council for Science(2013).
[8] Future Earth 2025 Vision. Paris: International Council for Science(2014).
[9] Intergovernmental Panel on Climate Change Special Report on Emissions Scenarios. Geneva, Switzerland: Intergovernmental Panel on Climate Change(2007).
[10] L Jiang, F B Xu. Review on climate change and food security. International Information, 5, 37-42(2011).
[11] S Z Kang. Towards water and food security in China. Chinese Journal of Eco-Agriculture, 22, 880-885(2014).
[12] A A Karabulut, E Crenna, S Sala et al. A proposal for integration of the ecosystem-water-food-land-energy (EWFLE) nexus concept into life cycle assessment: A synthesis matrix system for food security. Journal of Cleaner Production, 172, 3874-3889(2018).
[13] Z P Li, D C Li, T L Zhang. Threat and strategies of soil degradation to food security. Bulletin of Soil and Water Conservation, 21, 65-69(2001).
[14] Y Liu, W W Zhao, X Zhang. Promoting the delivering on the Environmental Dimension of the 2030 Agenda for Sustainable Development: Summary of the second session of the United Nations environment assembly. Acta Ecologica Sinica, 36, 3843-3846(2016).
[15] Y S Liu, Y H Li. Revitalize the world’s countryside. Nature, 548, 275-277(2017).
[16] Y X Liu, W W Zhao. Future Earth: Research programme on global sustainability. Acta Ecologica Sinica, 33, 7610-7613(2013).
[17] Y X Liu, W W Zhao, J Wang. Coordinated response to global change for sustainable development: Future Earth 2025 Vision. Acta Ecologica Sinica, 35, 2414-2417(2015).
[18] X L Luo, Y Zhang, H D Yang. Definition of food security in China and its evaluation. Journal of Shandong Agricultural University, 30, 14-18(2006).
[19] S Maxwell, M Smith. Household food security: A conceptual review. In: Maxwell S et al.Household food security: Concepts, indicators, measurements: A technical review. UNICEF and IFAD, 1-6(1992).
[20] H A Rahib, U Kaan, I Umit et al. Assessment of food security risk level using type 2 fuzzy system. Procedia Computer Science, 102, 547-554(2016).
[21] L M Shao. China grain safety early-warning system. Agricultural Economics and Management, 2, 10-19(2011).
[22] E C Stephens, A D Jones, D Parsons. Agricultural systems research and global food security in the 21st century: An overview and roadmap for future opportunities. Agricultural Systems, 1, 1-6(2017).
[23] W H Thomas, L C B Uris. Attaining food and environmental security in an era of globalization. Global Environmental Change, 41, 195-205(2016).
[24] W B Wu, H J Tang, P Yang et al. Model-based assessment of food security at a global scale. Acta Geographica Sinica, 65, 907-918(2010).
[25] X X Zhu, X Q Fang, Y Gao. Assessment of the food security in China based on system science. Chinese Journal of Agricultural Resources and Regional Planning, 33, 11-17(2012).

Set citation alerts for the article
Please enter your email address
© Copyright 2018-2021 | Chinese Laser Press. All Rights Reserved 沪ICP备15018463号-20