• Spectroscopy and Spectral Analysis
  • Vol. 41, Issue 2, 372 (2021)
Hui-ping LEI1、1、*, Bing-liang HU1、1, Tao YU1、1, Jia-cheng LIU1、1, Wei LI1、1, Xue-ji WANG1、1, Yan ZOU1、1, and Qian SHI1、1
Author Affiliations
  • 1[in Chinese]
  • 11. Xi’an Institute of Optics and Precision Machanics, Chinese Academy Sciences, Xi’an 710119, China
  • show less
    DOI: 10.3964/j.issn.1000-0593(2021)02-0372-07 Cite this Article
    Hui-ping LEI, Bing-liang HU, Tao YU, Jia-cheng LIU, Wei LI, Xue-ji WANG, Yan ZOU, Qian SHI. Research on the Quantitative Analysis Method of Nitrate in Complex Water by Full Scale Spectrum With GS-SVR[J]. Spectroscopy and Spectral Analysis, 2021, 41(2): 372 Copy Citation Text show less
    Determination of parameter search space
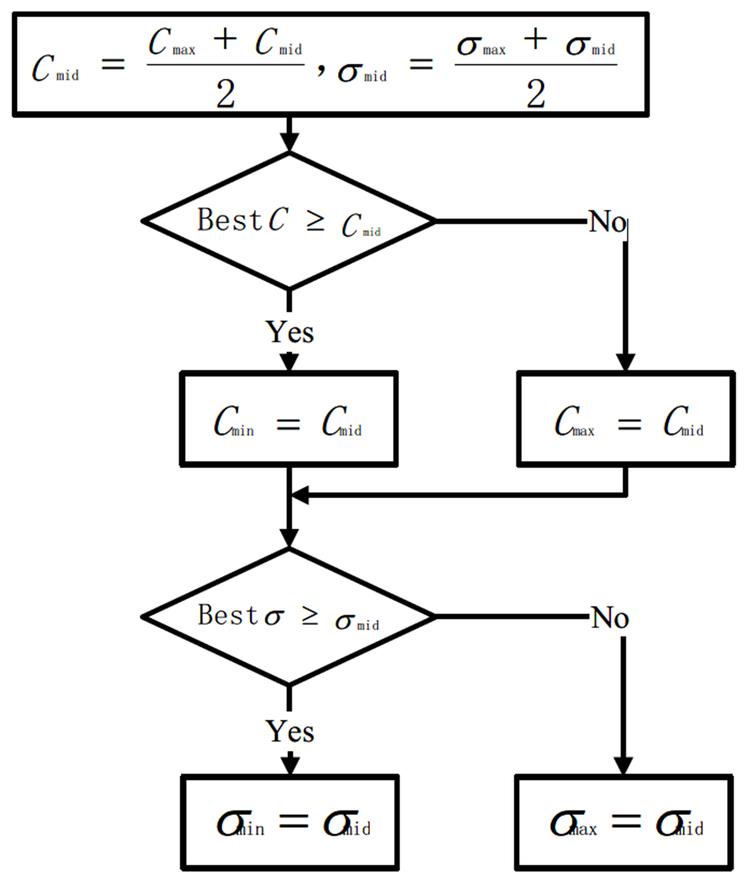
    Fig. 1. Determination of parameter search space
    Overall flow of the experiment
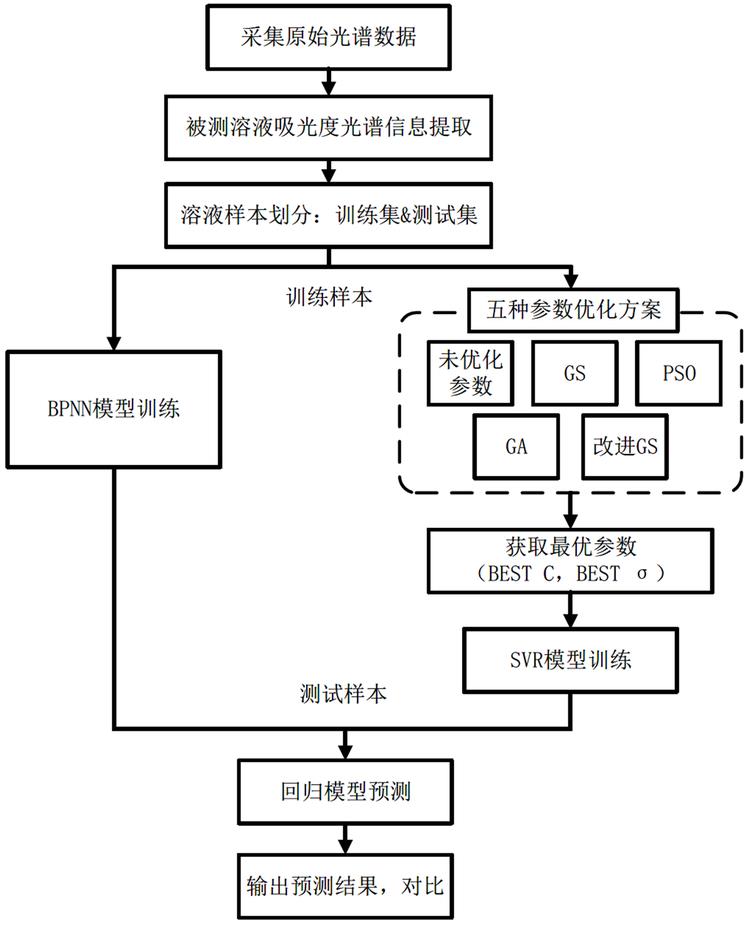
    Fig. 2. Overall flow of the experiment
    Main measurement technology schematic diagram of spectrometric method
    Fig. 3. Main measurement technology schematic diagram of spectrometric method
    Absorption spectrum of 94 samples with different concentrations
    Fig. 4. Absorption spectrum of 94 samples with different concentrations
    3D view for the first parameter optimization of Improved GS-SVR
    Fig. 5. 3D view for the first parameter optimization of Improved GS-SVR
    3D view for the second parameter optimization of Improved GS-SVR
    Fig. 6. 3D view for the second parameter optimization of Improved GS-SVR
    3D view for the third parameter optimization of Improved GS-SVR
    Fig. 7. 3D view for the third parameter optimization of Improved GS-SVR
    (a) Comparison between the predicted value of improved GS-SVR and the real value; (b) Relative error of the predicted value of improved GS-SVR
    Fig. 8. (a) Comparison between the predicted value of improved GS-SVR and the real value; (b) Relative error of the predicted value of improved GS-SVR
    (a) Comparison between predicted value and real value of different prediction models; (b) Relative error of predicted values of different prediction models
    Fig. 9. (a) Comparison between predicted value and real value of different prediction models; (b) Relative error of predicted values of different prediction models
    序号(C, σ)R2RMSEPTime/s(C, σ)R2RMSEPTime/s
    BPNNSVR
    1-0.955 50.059 372-0.889 70.758 9<1
    2-0.969 70.056 462-0.889 70.758 9<1
    3-0.715 40.137 053-0.889 70.758 9<1
    4-0.918 70.116 950-0.889 70.758 9<1
    5-0.981 50.041 6101-0.889 70.758 9<1
    GS-SVRPSO-SVR
    1(512, 0.011)0.985 80.177 5116(64, 0.385 8)0.980 90.112 8348
    2(512, 0.011)0.985 80.177 5111(51, 0.133 1)0.981 20.158 5268
    3(512, 0.011)0.985 80.177 5133(100, 0.178 6)0.986 20.078 3300
    4(512, 0.011)0.985 80.177 5103(100, 0.010 0)0.936 30.820 7271
    5(512, 0.011)0.985 80.177 5138(100, 0.852 5)0.966 50.206 7270
    GA-SVR改进GS-SVR
    1(77, 0.128 7)0.983 60.106 1136(512, 0.044 2)0.993 50.043 513
    2(99, 0.038 1)0.976 70.240 8164(512, 0.044 2)0.993 50.043 513
    3(99, 0.111 6)0.985 90.092 6128(512, 0.044 2)0.993 50.043 514
    4(99, 0.036 2)0.975 90.247 4177(512, 0.044 2)0.993 50.043 513
    5(99, 0.038 1)0.976 60.242 2124(512, 0.044 2)0.993 50.043 513
    Table 1. Comparison of evaluation parameters of different prediction models
    Hui-ping LEI, Bing-liang HU, Tao YU, Jia-cheng LIU, Wei LI, Xue-ji WANG, Yan ZOU, Qian SHI. Research on the Quantitative Analysis Method of Nitrate in Complex Water by Full Scale Spectrum With GS-SVR[J]. Spectroscopy and Spectral Analysis, 2021, 41(2): 372
    Download Citation