Abstract
Stimulated emission depletion (STED) microscopy is one of far-field optical microscopy techniques that can provide sub-diffraction spatial resolution. The spatial resolution of the STED microscopy is determined by the specially engineered beam profile of the depletion beam and its power. However, the beam profile of the depletion beam may be distorted due to aberrations of optical systems and inhomogeneity of a specimen’s optical properties, resulting in a compromised spatial resolution. The situation gets deteriorated when thick samples are imaged. In the worst case, the severe distortion of the depletion beam profile may cause complete loss of the super-resolution effect no matter how much depletion power is applied to specimens. Previously several adaptive optics approaches have been explored to compensate aberrations of systems and specimens. However, it is difficult to correct the complicated high-order optical aberrations of specimens. In this report, we demonstrate that the complicated distorted wavefront from a thick phantom sample can be measured by using the coherent optical adaptive technique. The full correction can effectively maintain and improve spatial resolution in imaging thick samples.1. INTRODUCTION
Stimulated emission depletion (STED) microscopy [1,2] is one of the major super-resolution imaging techniques, which achieves a spatial resolution that is not limited by light diffraction. In STED microscopy, the super resolution is achieved by adding a second laser beam, the depletion beam, co-aligned with the excitation beam. The function of the depletion beam is to force the excited fluorescence molecules back to their ground states via a non-fluorescent process, stimulated emission. By contriving the depletion beam with a minimum intensity (almost zero) at the center, the point spread function (PSF) of the fluorescence imaging is effectively narrowed below the light diffraction limit. STED microscopy stands out from various super-resolution imaging methods, such as photoactivated localization microscopy (PALM) [3], stochastic optical reconstruction microscopy (STORM) [4], and saturated structured illumination microscopy (SSIM) [5] for its capability of imaging dynamic biological processes in thick tissues [6,7]. The imaging depth of STED microscopy is limited by optical aberrations of specimens, similar to other deep tissue imaging methods, such as confocal and two-photon fluorescence microscopy [8–15]. Optical aberrations of the imaging light path in biological tissues are fundamentally caused by the inhomogeneity of refractive index at a cellular or subcellular scale. In addition to aberrations that may exist in optical systems, the sample aberration affects all three optical paths, i.e., excitation, depletion, and detection, in an STED microscope, resulting in a reduced signal level and spatial resolution. Nonetheless, recent studies [10–13,16,17] suggest that the spatial resolution and the depletion efficiency are determined primarily by the depletion beam path. This is easy to understand, as the doughnut-shaped focus of the depletion beam is generated by introducing a complicated phase mask to the beam; any small disturbance of the light field may severely distort the shape of the focus. On the other hand, if we can find phase distortion that is caused by aberrations, we should be able to correct these aberrations to ensure high spatial resolution in deep tissue.
Correcting aberrations in super-resolution microscopy has recently received increasing attention, especially in STED super-resolution microscopy [11–13]. The current approach in finding the correction phase relies on reducing coefficients of Zernike polynomials using the image quality as a feedback. Gould et al. [12] used Zernike polynomials to find aberration corrections on both the excitation beam path and depletion beam path. Lenz et al. [13] used a similar approach to improve the spatial resolution by correcting the system aberration in the depletion beam path of a 3D STED system. Although effective for low-order aberrations, the approach is often limited by the challenge of measuring and correcting the complicated higher-order optical aberration of biological samples [18]. Here, we report an aberration correction approach in STED microscopy by measuring the phase distortion of samples with the coherent optical adaptive technique (COAT) method. Originally developed for astronomy imaging, the COAT method was recently introduced to the optical microscopy field in optimizing the light focusing in scattering media [19]. In our experiment, a spatial light modulator (SLM) was introduced to the depletion beam path to provide the spiral phase for generating the doughnut-shaped focus and the correction phase for reducing aberrations.
2. STED MICROSCOPE SETUP
As shown in Fig. 1, our home-built STED microscope system has three beam paths: excitation, depletion, and detection. The excitation beam path started with a 635 nm picosecond diode laser with its driver (LDH-D-635 and PDL 800-D, PicoQuant Photonics North America Inc., West Springfield, MA, USA), which was synchronized to the depletion laser repetition frequency. The depletion beam path started with the depletion laser source, which was an ultrafast Ti:sapphire laser (Tsunami HP, Newport Corp., Irvine, CA, USA) with a wavelength at 750 nm and a repetition rate at 80 MHz. To maintain the high depletion efficiency, the 100 fs pulses from the Tsunami were broadened to be a few hundred picoseconds. This was achieved by letting the light first transmit through a 40 cm long H-ZF52A (Schott SF57 equivalent) glass rod and then a 100 m long single mode polarization maintaining fiber (PM630-HP, Thorlabs Inc., Newton, NJ, USA) to reach a few hundred picoseconds. An SLM (PLUTO NIR-II, HOLOEYE Photonics AG, Berlin-Adlershof, Germany) was used to apply the spiral phase for generating the doughnut-shaped focus and at the same time correction phases for aberrations. A half-wave plate was used to match the required polarization with the optimal performance of the SLM. The excitation and depletion beams were combined using dichroic mirrors (DM1 and DM2). A quarter-wave plate was used to convert both beams to circular polarized ones before they entered an oil immersion objective (HCX PL APO, , NA1.4-0.7, Leica, Berlin, Germany). Laser scanning was performed by a pair of galvanometer scanning mirrors (6210H, Cambridge Technology Inc., Cambridge, MA, USA). Starting with samples, the detection beam path was a confocal imaging path that included the objective, the scanner, and a multimode fiber that worked as a pinhole in a confocal microscope. The emission signal was detected by a photomultiplier tube (PMT) (H7422PA-40, Hamamatsu Photonics K.K., Japan). ScanImage (HHMI/Janelia Farm, Ashburn, VA, USA), an open-source program developed in MATLAB (Mathworks, Natick, MA, USA), was used to control the galvanometer scanning mirrors and to acquire images.
Sign up for Photonics Research TOC. Get the latest issue of Photonics Research delivered right to you!Sign up now
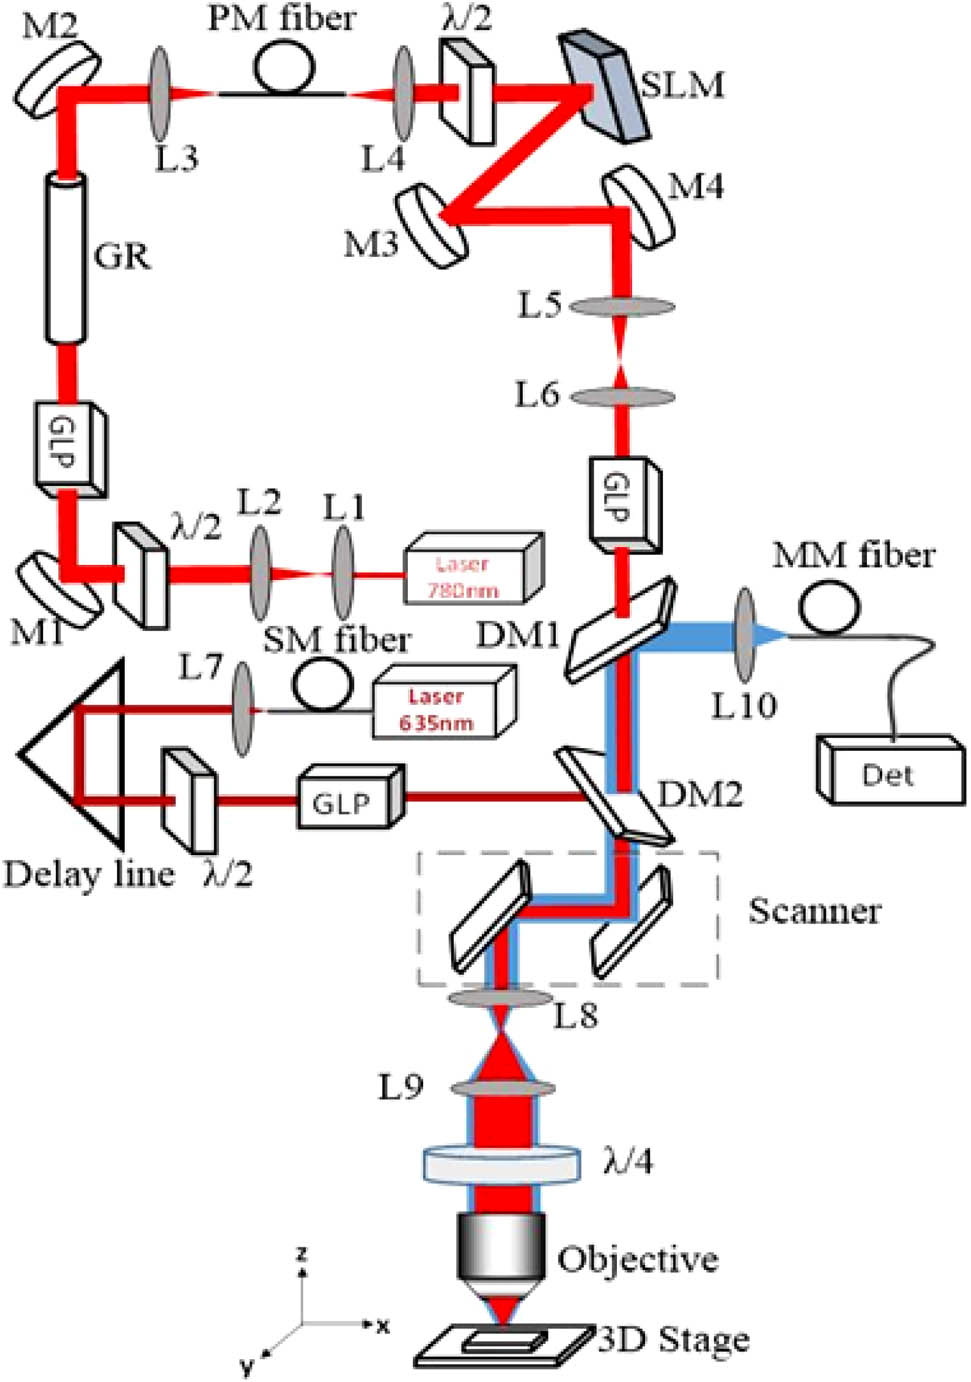
Figure 1.Schematic of the COAT-STED microscope. L, lens; GLP, Glan laser polarizer; M, mirrors; DM1 (T: 720–1200 nm, R: 350–720 nm), DM2 (T: 650–800 nm, R: 600–650 nm): dichroic mirrors; GR, glass rod; , half-wave plate; , quarter-wave plate; Det, PMT or CCD; SM fiber, single mode fiber; PM fiber, polarization maintaining fiber; MM fiber, multimode fiber.
3. ABERRATION CORRECTION
The COAT aberration correction method was proposed by Hughes Research Laboratories in the 1970s for focusing a laser beam through a turbulent atmosphere [20]. The COAT method has been recently demonstrated in microscopy imaging [19,21] to achieve high-speed and high-precision wavefront control with improved freedom in comparison with the Zernike polynomials-based methods. Because the depletion beam has more impact on the resolution, we only did aberration correction with the SLM on the depletion beam. Previous published papers [21–23] used the total image brightness (sum of pixel values) as an image quality metric for finding correction phases in confocal and two-photon microscopy systems. In the STED system, Gould et al. used image brightness and sharpness as the quality metrics of PSFs [12]. Here we use a different strategy for correcting aberrations in the depletion beam. The idea is that, if we can find the correction phase for the depletion beam path with a Gaussian beam, we should be able to use the same correction phase plus the spiral phase to achieve the corrected “doughnut” focus as well. The correction procedure takes the following steps: (1) a blazed grating phase mask is loaded on the SLM to focus the depletion beam into a point-shaped PSF; (2) a series of predesigned phase masks used in the COAT method are applied on the SLM to find the correction phases according to the intensity of the focus; (3) the correction phase is combined with the spiral phase mask to generate the doughnut-shaped PSF. The correction phase is found by using the multidither COAT method illustrated in Fig. 2. The SLM is divided into () correction segments, in each of which all the pixels are applied with the same phase value. Figure 2(a) shows nine correction segments as an example. To find the correction phase mask, the COAT method in general repeats a correction cycle multiple times. The correction cycle has two major steps. In the first step, the half of the segments (in white) are kept with a constant value used as a phase reference, while the other half of the segments (in blue) are applied with periodically modulated phases that vary from 0 to . Because the phase of each blue segment is modulated at different frequencies (, , , , and ), the intensity of the focusing spot contains all the modulation frequencies and would reach maximums when the phases are constructive with the reference phase at the focus. The plot in Fig. 2(c) shows a recorded intensity change of the PSF image over time during the phase tuning process. The correction phases of the blue segments are obtained by performing Fourier transform of the curve in Fig. 2(d) and finding the phase values according to the modulation frequencies (, , , , and ). In the second step, we apply the found phases (, , , , and ) to the blue segments and repeat the phase tuning on the white segments to find their correction phases as described in the first step. These two steps conclude one correction cycle and can be repeated multiple times to improve the correction result. In our experiments, we only use one cycle of correction to reduce the amount of time spent in correction procedures. Figures 2(e) and 2(f) show the depletion beam PSFs before and after correction, respectively. Comparing the intensity of the two PSFs [see Fig. 2(g)], we can see that, after COAT correction, the intensity had significantly improved, though only nine correction segments are used.

Figure 2.(a)–(d) Steps of the COAT phase measurement for directly achieving wavefront correction phase patterns. (e) PSF measured by imaging a GNP mounted on a slide when passing the unmodulated beam though the depletion beam path. (f) PSF of depletion beam after correction. (g) Intensity profiles of the depletion beam before and after correction.
We investigated how the number of correction segments affected the aberration correction. In our experiment, we compared three different arrays of phase control segments: , , and . The aberration correction was performed by using the confocal microscope to image 150 nm diameter gold nanoparticles (GNPs). The laser wavelength was tuned to 750 nm, and the scattering light from GNPs was collected. The GNPs were mounted on the surface of a slide with a 170 μm coverslip. Figure 3(a) shows GNP images with different correction configurations. The intensity of focus is continuously increased with the number of correction segments. The correction phases in Figs. 3(c) and 3(d) show a relative symmetric distribution of correction phases, which may indicate that spherical aberration is present in the system.
Figure 3.SLM was configured to provide different phase control segments for aberration correction. (a) Achieved PSFs of no correction and corrected depletion beam with three kinds of phase control segments (correction 1: squares, correction 2: squares, and correction 3: squares). (b) Intensity profiles of the PSFs for no correction, correction 1, correction 2, and correction 3. (c), (d), and (e) Correction phase patterns used for correction 1, 2, and 3, respectively.
In order to test the effectiveness of the COAT method in correcting aberrations of STED microscopy with thick samples, we created a 170 μm thick 5% agarose (scattering phantom) sample, which was sandwiched between two 170 μm thick coverslips separated by a 170 μm thick spacer. As shown in Fig. 4, at the bottom of the upper coverslip is mounted by 150 nm GNPs, while on the top of the lower coverslip both 150 nm GNPs and 170 nm fluorescent microspheres (FMSs) are mounted. The reason for creating such a phantom sample was to separate the aberrations from different sources so that we could test our hypothesis that more complicated correction phases were needed to correct the aberrations from samples. We first used the COAT method to correct the aberration of the upper GNPs using scattering signals; the correction phase obtained at this stage was to correct the aberrations from all the sources except the agarose sample itself, i.e., the system correction. We then used the same method to correct the aberration of the bottom GNPs; this process corrected aberrations from both the system and the sample, i.e., full correction. We used 81 correction segments, and their phase modulations were tuned from 2.5 to 4.8 Hz [18]. At last we imaged the 170 nm FMSs to test how aberration correction affected the performance of the STED microscope. Figure 5(a) shows the acquired PSFs of a Gaussian beam on the depletion path under the condition of no correction, system correction, and full correction. These images were acquired by loading each correction phases on the SLM and imaging the same GNP that was located at the bottom layer of the phantom sample. The correction clearly improves the intensity and sharpness of the focus, as shown in Fig. 5(b). The correction phase shown in Fig. 5(d) exhibits a much more random distribution, which demonstrates that the scattering media actually has more complicated phase correction because of the inhomogeneity of the refractive index of the scattering sample.
Figure 4.Phantom sample. Middle green region is 5% agarose. Yellow balls are 150 nm GNPs. Red balls are 170 nm FMSs.
Figure 5.Correction aberration with COAT ( segments) for the depletion beam path. (a) PSFs of depletion beam with no correction, the system correction, and the full correction. (b) PSF intensity profiles. (c) Phase mask for the system correction. (d) Phase mask for the full correction.
Once we obtained the correction phases, we synthesized new correction phases by combining the spiral phase pattern and the COAT correction phases for STED microscopy. To validate the new correction phases, we imaged the 3D PSFs with no correction, system correction, and full correction. As shown in Fig. 6, the doughnut-shaped focus is greatly improved after the full correction. At the final step of STED alignment procedure, we verified the PSFs of the depletion beam and excitation beam by imaging GNPs at the bottom layer of the agarose sample. As shown in Fig. 7, the depletion beam is properly overlapped with the excitation beam. The normalized intensity at the center of the PSF is decreased from about 20% (no correction) to 15% (full correction), indicating that the COAT method has effectively improved the quality of the depletion beam. After correction, the intensity of the depletion beam also is increased. All these improvements should result in improved spatial resolution of the STED imaging. This was confirmed by imaging the FMBs at the lower layer of the phantom, as shown in Fig. 8. All images were taken with the excitation at 635 nm (0.5 mW) and the depletion at 750 nm (19.2 mW). The power was measured at the pupil of the objective. The FWHMs of the no correction, system correction, and full correction are 214, 207, and 178 nm, respectively. The results showed that the spatial resolution was improved once the full correction was applied, which demonstrated again that the aberration of the thick sample itself affected the spatial resolution.
Figure 6.Profiles of STED beam PSFs with no correction, system correction, and full correction. Upper: profiles of XY section; bottom: profiles of XZ section.
Figure 7.Imaging GNPs overlay beams of no correction and full correction with excitation beam. (a) Overlay beam of no correction. (b) Overlay beam of full correction. (c) PSFs intensity curves of no correction depletion beam, correction depletion beam, and excitation beam.
Figure 8.(a) Confocal, STED 1 (no correction), STED 2 (system correction), and STED 3 (full correction) images of a single FMS. (b) Normalized intensity profiles of the images.
We further investigated the COAT correction method with biological specimens. Heart tissues from a Sprague–Dawley rat was frozen sectioned into 50 μm thick slices, which were incubated with anti-sarcomeric alfa-actinin antibody (Abcam, Cambridge, UK) and secondary antibody with Alexa Flour 647 (Life Technologies, Carlsbad, CA, USA) to label sarcomere structures. Instead of using the confocal imaging of the scattering light of targets, we used a CCD camera to image the reflected focus on the interface of the sample and the coverslip when parking the galvo scanner at the center of the field of view. Performing the COAT measurement to optimize the focus intensity, we found the correction phase for the system. Figure 9 compares confocal, STED, and aberration corrected STED images of sarcomeric structures. Figures 9(a)–9(c) and their enlarged region of interests (blue boxed areas) clearly show that aberration correction improves the spatial resolution of STED images, which is confirmed by the line profiles [blue lines in Figs. 9(a)–9(c)] shown in Fig. 9(j). Figure 9(m) shows the final correction phase masks for the system correction. In order to investigate the relation of imaging depth to the system aberration correction, we give three different imaging depths: 7, 19, and 36 μm. Figures 9(a)–9(c), 9(d)–9(f), and 9(g)–9(i) were acquired at 7, 19, and 36 μm, respectively. Figures 9(j)–9(l) show that the system aberration correction for improvement resolution gradually weakens with the imaging depth increasing. The main reason for this phenomenon is that the aberration of the sample increases with the imaging depth.
Figure 9.Images of rat heart tissue sample at different depths (7, 19, and 36 μm): The first line are (a) confocal, (b) STED with no correction, and (c) STED with system correction (aberration-corrected STED: AC STED) at 7 μm depth; the second line (d)–(f) are imaging at 19 μm depth; the third line (g)–(i) are imaging at 36 μm depth. The enlarged blue boxed areas are shown in the inset. (j)–(l) Intensity profiles along the blue lines. (m) Final correction phase applied to the SLM.
4. SUMMARY
In summary, we introduce a new aberration correction method in STED microscopy using the COAT phase measurement. We demonstrate that the complicated distortion wavefront from a thick phantom sample can be measured by using the COAT. The full correction can effectively maintain and improve the spatial resolution in imaging thick samples. We also demonstrate that the spatial resolution can be improved in imaging biological samples with the system correction.
Although we have successfully performed the COAT method in STED microscopy with the full correction on a scattering phantom sample and the system correction on biological samples, lots of work still has to be done toward the full and real-time correction in biological samples. The biggest issue is the imaging speed and update rate of the SLM. In our current system, the SLM frame update every 0.1 s, and it takes 0.2 s to acquire one image. According to sampling theorem, the minimum number of samplings required for the N phase values is 2N. To complete one correction cycle, at least 4N of images are required, which may take an exceedingly long time if the correction segments are large. The small amount of correction segments also limits the capability of accurately finding correction phases. Nonetheless, high-speed SLMs and high-speed scanners are available; the COAT-based STED microscopy should provide a practical way to correct aberrations from scattering media and improve the spatial resolution in imaging thick biological samples.
References
[1] S. W. Hell, J. Wichmann. Breaking the diffraction resolution limit by stimulated-emission: stimulated emission depletion fluorescence microscopy. Opt. Lett., 19, 780-782(1994).
[2] T. A. Klar, S. W. Hell. Subdiffraction resolution in far-field fluorescence microscopy. Opt. Lett., 24, 954-956(1999).
[3] E. Betzig, G. H. Patterson, R. Sougrat, O. W. Lindwasser, S. Olenych, J. S. Bonifacino, M. W. Davidson, J. L. Schwartz, H. F. Hess. Imaging intracellular fluorescent proteins at nanometer resolution. Science, 313, 1642-1645(2006).
[4] M. Rust, M. Bates, X. Zhuang. Sub-diffraction-limit imaging by stochastic optical reconstruction microscopy. Nat. Methods, 3, 793-796(2006).
[5] M. G. L. Gustafsson. Nonlinear structured-illumination microscopy: wide-field fluorescence imaging with theoretically unlimited resolution. Proc. Natl. Acad. Sci. USA, 102, 13081-13086(2005).
[6] G. Moneron, S. W. Hell. Two-photon excitaion STED microscopy. Opt. Express, 17, 14567-14573(2009).
[7] N. T. Urban, K. I. Willig, S. W. Hell, U. V. Nagerl. STED nanoscopy of actin dynamics in synapses deep inside living brain slices. Biophys. J., 101, 1277-1284(2011).
[8] W. Yu, Z. Ji, D. Dong, X. Yang, Y. Xiao, Q. Gong, P. Xi, K. Shi. Super-resolution deep imaging with hollow Bessel beam STED microscopy. Laser. Photon. Rev., 10, 147-152(2016).
[9] M. J. Booth. Adaptive optics in microscopy. Philos. Trans. R. Soc. A, 365, 2829-2843(2007).
[10] M. J. Booth. Adaptive optical microscopy: the ongoing quest for a perfect image. Light Sci. Appl., 3, e165(2014).
[11] M. J. Booth. Aberrations and adaptive optics in super-resolution microscopy. Microscopy, 64, 251-261(2015).
[12] T. J. Gould, D. Burke, J. Bewersdorf, M. J. Booth. Adaptive enables 3D STED microscopy in aberrating specimens. Opt. Express, 20, 20998-21009(2012).
[13] M. O. Lenz, H. G. Sinclair, A. Savell, J. H. Clegg, A. C. Brown, D. M. Davis, C. Dunsby, M. A. Neil, P. M. French. 3-D stimulated emission depletion microscopy with programmable aberration correction. J. Biophoton., 7, 29-36(2014).
[14] I. C. Hernandez, M. Castello, L. Lanzano, M. D. Amora, P. Bianchini, A. Diaspro, G. Vicidomini. Two-photon excitation STED microscopy with time-gated detection. Sci. Rep., 6, 19419(2016).
[15] S. Deng, L. Liu, Y. Cheng, R. Li, Z. Xu. Effects of primary aberrations on the fluorescence depletion patterns of STED microscopy. Opt. Express, 18, 1657-1666(2010).
[16] S. Deng, L. Liu, Y. Cheng, R. Li, Z. Xu. Investigation of the influence of the aberration induced by a plane interface on STED microscopy. Opt. Express, 17, 1714-1725(2009).
[17] R. Liu, D. E. Milkie, A. Kerlin, B. M. Lennan, N. Ji. Direct phase measurement in zonal wavefront reconstruction using multidither coherent optical adaptive technique. Opt. Express, 22, 1619-1628(2014).
[18] M. Cui. Parallel wavefront optimization method for focusing light through random scattering media. Opt. Lett., 36, 870-872(2011).
[19] W. B. Bridges, P. T. Brunner, S. P. Lazzara, T. A. Nussmeier, T. R. Omeara, J. A. Sanguinet, W. P. Brown. Coherent optical adaptive technique. Appl. Opt., 13, 291-300(1974).
[20] N. Ji, D. E. Milkie, E. Betzig. Adaptive optics via pupil segmentation for high-resolution imaging in biological tissues. Nat. Methods, 7, 141-147(2009).
[21] K. Wang, W. Sun, C. T. Richie, B. K. Harvey, E. Betzig, N. Ji. Direct wavefront sensing for high-resolution in vivo imaging in scattering tissues. Nat. Commun., 6, 7276(2015).
[22] X. Tao, B. Fernandez, O. Azucena, M. Fu, D. Garcia, Y. Zuo, D. C. Chen, J. Kubby. Adaptive optics confocal microscopy using direct wavefront sensing. Opt. Lett., 36, 1062-1064(2011).
[23] M. A. Lauterbach, J. Keller, A. Schonle, D. Kamin, V. Westphal, S. O. Rizzoil, S. W. Hell. Comparring vedio-rate STED nanoscopy and confocal microscopy of living neurons. J. Biophoton., 3, 417-424(2010).


