
Zhenliang Chang, Xiaogang Yang, Ruitao Lu, Hao Zhuang. High-Resolution Remote Sensing Image Change Detection Based on Improved DeepLabv3+[J]. Laser & Optoelectronics Progress, 2022, 59(12): 1228006
- Laser & Optoelectronics Progress
- Vol. 59, Issue 12, 1228006 (2022)
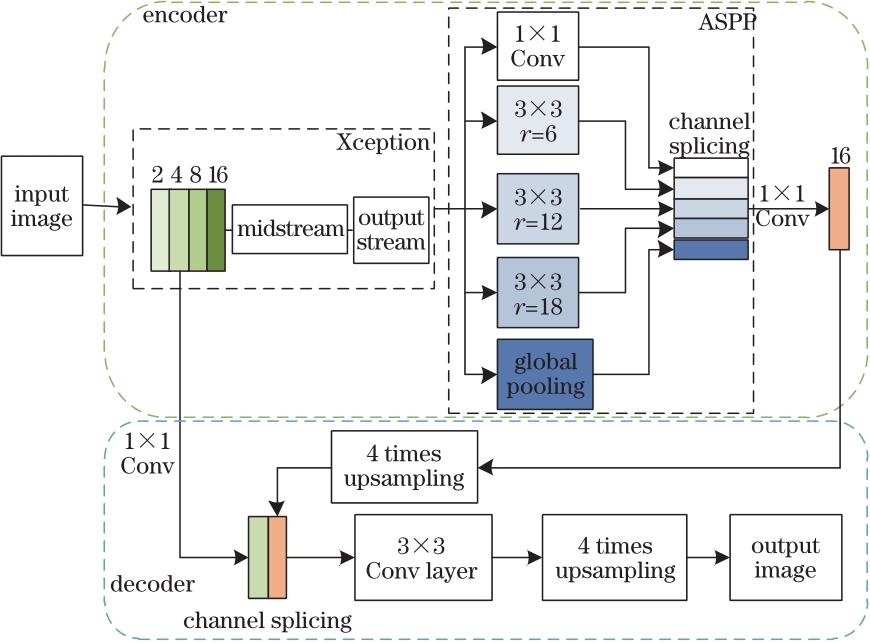
Fig. 1. Network structure of DeepLabv3+ basic model
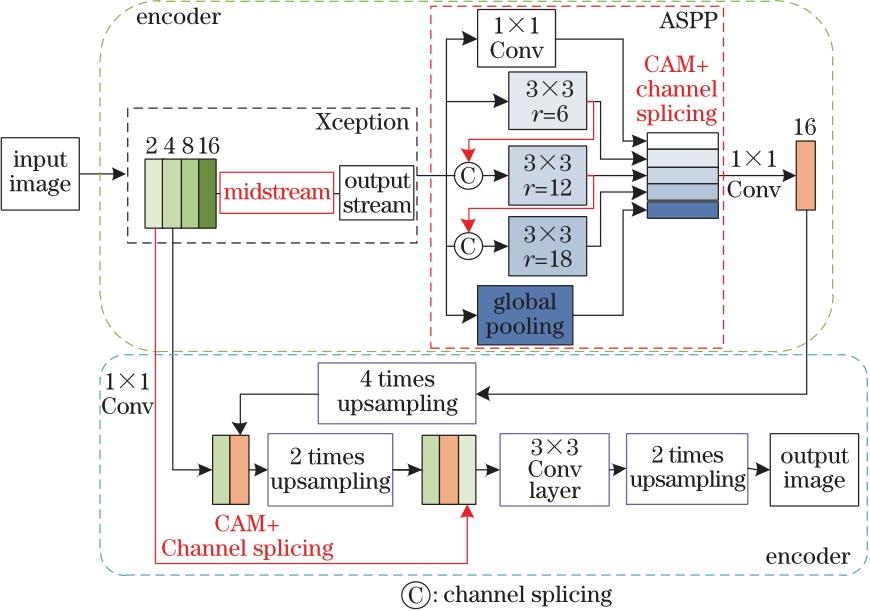
Fig. 2. Model structure of improved DeepLabv3+
Fig. 3. Hollow convolution of fusion of different receptive fields. (a) Channel stitching; (b) sampling point distribution of r=12 convolutional layer in original feature map; (c) sampling point distribution of r=12 convolutional layer in r=6 feature map
Fig. 4. Optimization of intermediate flow structure of backbone network
Fig. 5. Structure of channel attention module
Fig. 6. Part of training samples
Fig. 7. Basic structure of deep convolutional generative confrontation network
Fig. 8. Changes in different scenarios and time periods. (a) Scene 1; (b) scene 2
Fig. 9. Accuracy curve and loss curve of DeepLabv3+ network. (a) Accuracy curve; (b) loss curve
Fig. 10. Accuracy curve and loss curve of improved DeepLabv3+ network. (a) Accuracy curve; (b) loss curve
Fig. 11. Change detection results of DeepLabv3+ (left) and improved DeepLabv3+ (right). (a) Scene 1; (b) scene 2
Fig. 12. Landsat 8 test images. (a) Scene 3; (b) scene 4
Fig. 13. DeepLabv3+ (left) and improved DeepLabv3+ (right) detection results. (a) Scene 3; (b) scene 4
Fig. 14. Part of images of OSCD dataset. (a) Scene 5; (b) scene 6
Fig. 15. DeepLabv3+ (left) and improved DeepLabv3+ (right) change detection results. (a) Scene 5; (b) scene 6
|
Table 1. Effect of fusion of different receptive fields on convolution of holes
|
Table 2. Comparison of change detection results of different methods
|
Table 3. Change detection results of deep convolution method based on Landsat 8 data
|
Table 4. Comparison of depth change detection results based on OSCD data

Set citation alerts for the article
Please enter your email address
© Copyright 2018-2021 | Chinese Laser Press. All Rights Reserved 沪ICP备15018463号-20