• Photonics Research
  • Vol. 9, Issue 12, 2381 (2021)
Hailang Dai1、†, Hongrui Shan1、†, Zhangchi Sun2、3、†, Daopeng Dai4, Yuxi Shang1, Zhuangqi Cao1, and Xianfeng Chen1、5、*
Author Affiliations
  • 1State Key Laboratory of Advanced Optical Communication Systems and Networks, School of Physics and Astronomy, Shanghai Jiao Tong University, Shanghai 200240, China
  • 2Zhejiang Rongjun Hospital, Jiaxing 314000, China
  • 3School of Pharmacy, Shanghai Jiao Tong University, Shanghai 200240, China
  • 4Department of Cardiology, Ruijin Hospital, Shanghai Jiao Tong University School of Medicine, Shanghai 200240, China
  • 5Collaborative Innovation Centre of Light Manipulations and Applications, Shandong Normal University, Jinan 250358, China
  • show less
    DOI: 10.1364/PRJ.435686 Cite this Article Set citation alerts
    Hailang Dai, Hongrui Shan, Zhangchi Sun, Daopeng Dai, Yuxi Shang, Zhuangqi Cao, Xianfeng Chen. Single-cell detection by enhancement of fluorescence in waveguides for cancer diagnosis and therapy[J]. Photonics Research, 2021, 9(12): 2381 Copy Citation Text show less
    Detection of cancer cells via chromosome fluorescence. (a) Nonsmall cell lung cancer (NSCLC) cell is examined under a microscope to confirm the diagnosis; cells (1×10⁵−2×10⁵ mL−1) are seeded on normal slices. (b)–(e) Fluorescence images magnified 60 times for different cells by microscope; the chromosomes were stained by DAPI in cells. (f) Separation of different sizes and weights of cancer cells. (g)–(i) Normal and abnormal cell microscopic images show the detection of fluorescence intensity in our waveguide. (j) Drawing the map of cells which is distinguished according to the fluorescence intensity of normal and abnormal cells.
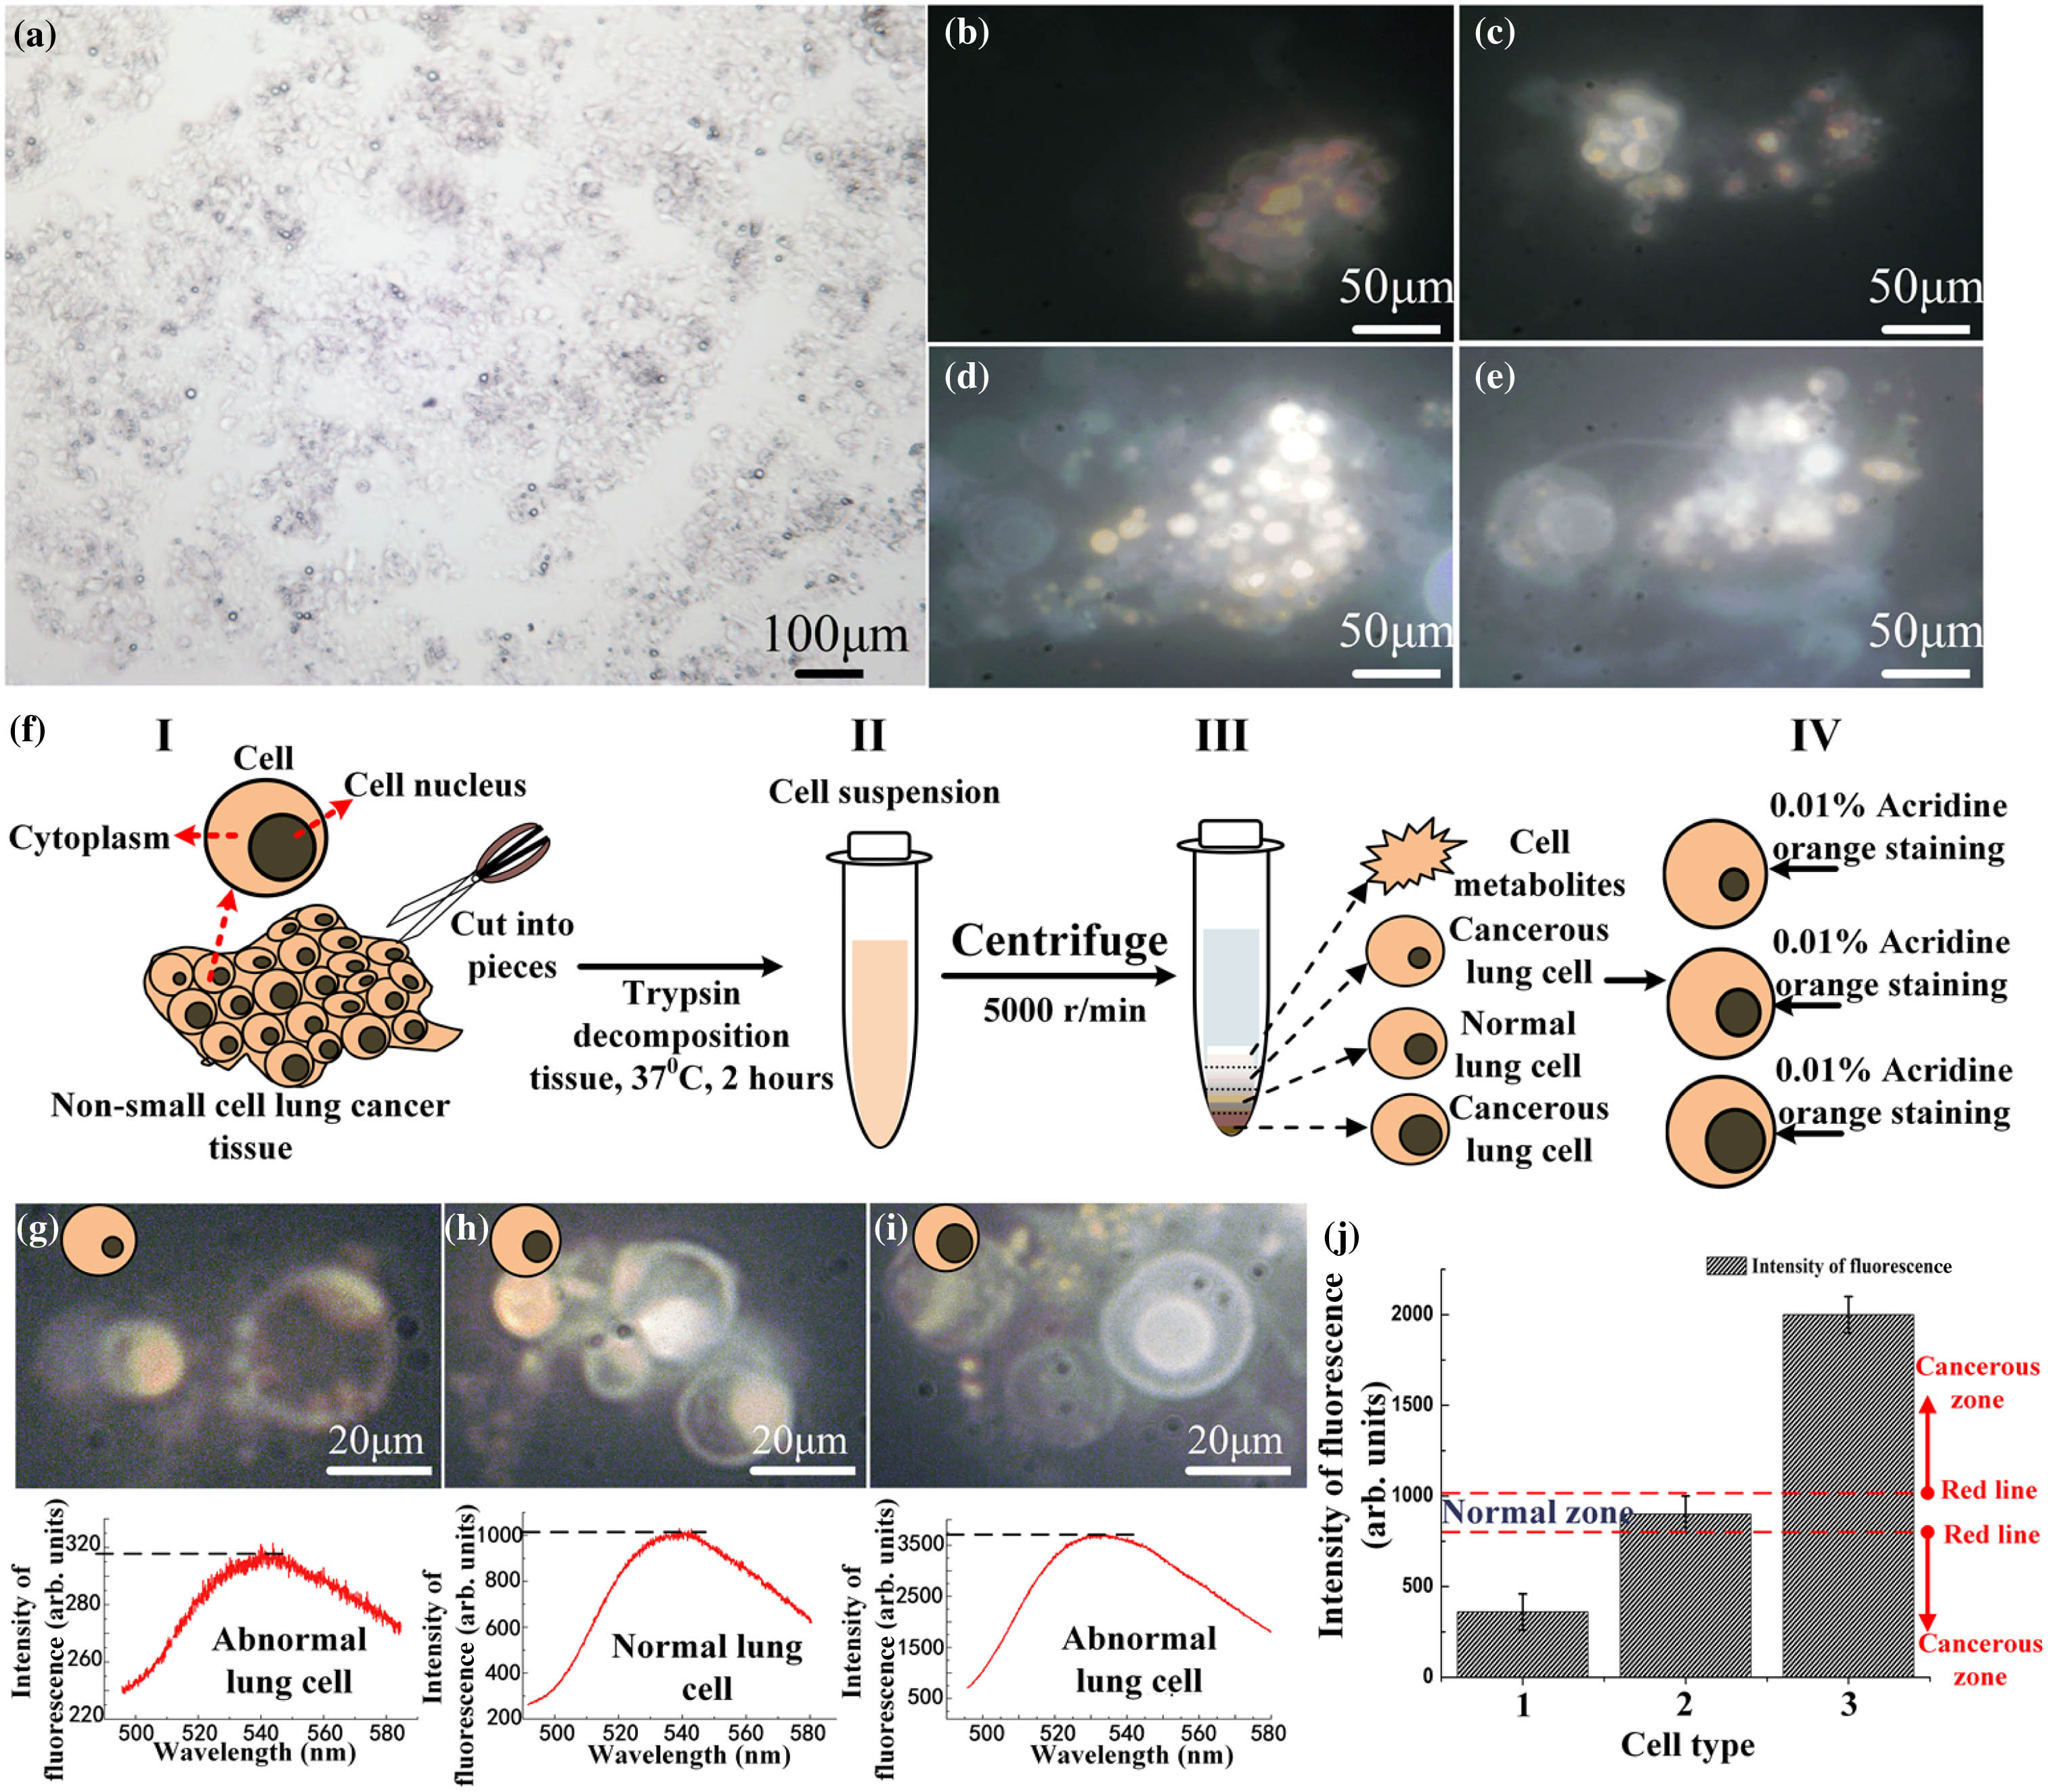
    Fig. 1. Detection of cancer cells via chromosome fluorescence. (a) Nonsmall cell lung cancer (NSCLC) cell is examined under a microscope to confirm the diagnosis; cells (1×1052×105mL1) are seeded on normal slices. (b)–(e) Fluorescence images magnified 60 times for different cells by microscope; the chromosomes were stained by DAPI in cells. (f) Separation of different sizes and weights of cancer cells. (g)–(i) Normal and abnormal cell microscopic images show the detection of fluorescence intensity in our waveguide. (j) Drawing the map of cells which is distinguished according to the fluorescence intensity of normal and abnormal cells.
    Experimental results show that the mouse’s chromosome number changes in the sperm cells. (a) Chromosome numbers of male mice. (b) Haploid sperm cells, diploid sperm cells, tetraploid sperm cells, and cytoplasm cells can be obtained from male mice spermatocyte stem cells during development and differentiation. (c) Haploid, diploid, tetraploid sperm cells, and cytoplasm cells imaged by microscope. (d)–(f) are fluorescent microscope imaging of the haploid, diploid, and tetraploid sperm cells, respectively. (g)–(i) Fluorescent intensity of the haploid, diploid, and tetraploid sperm cells, respectively. (j) Value of fluorescence peak of the haploid, diploid, and tetraploid sperm cells.
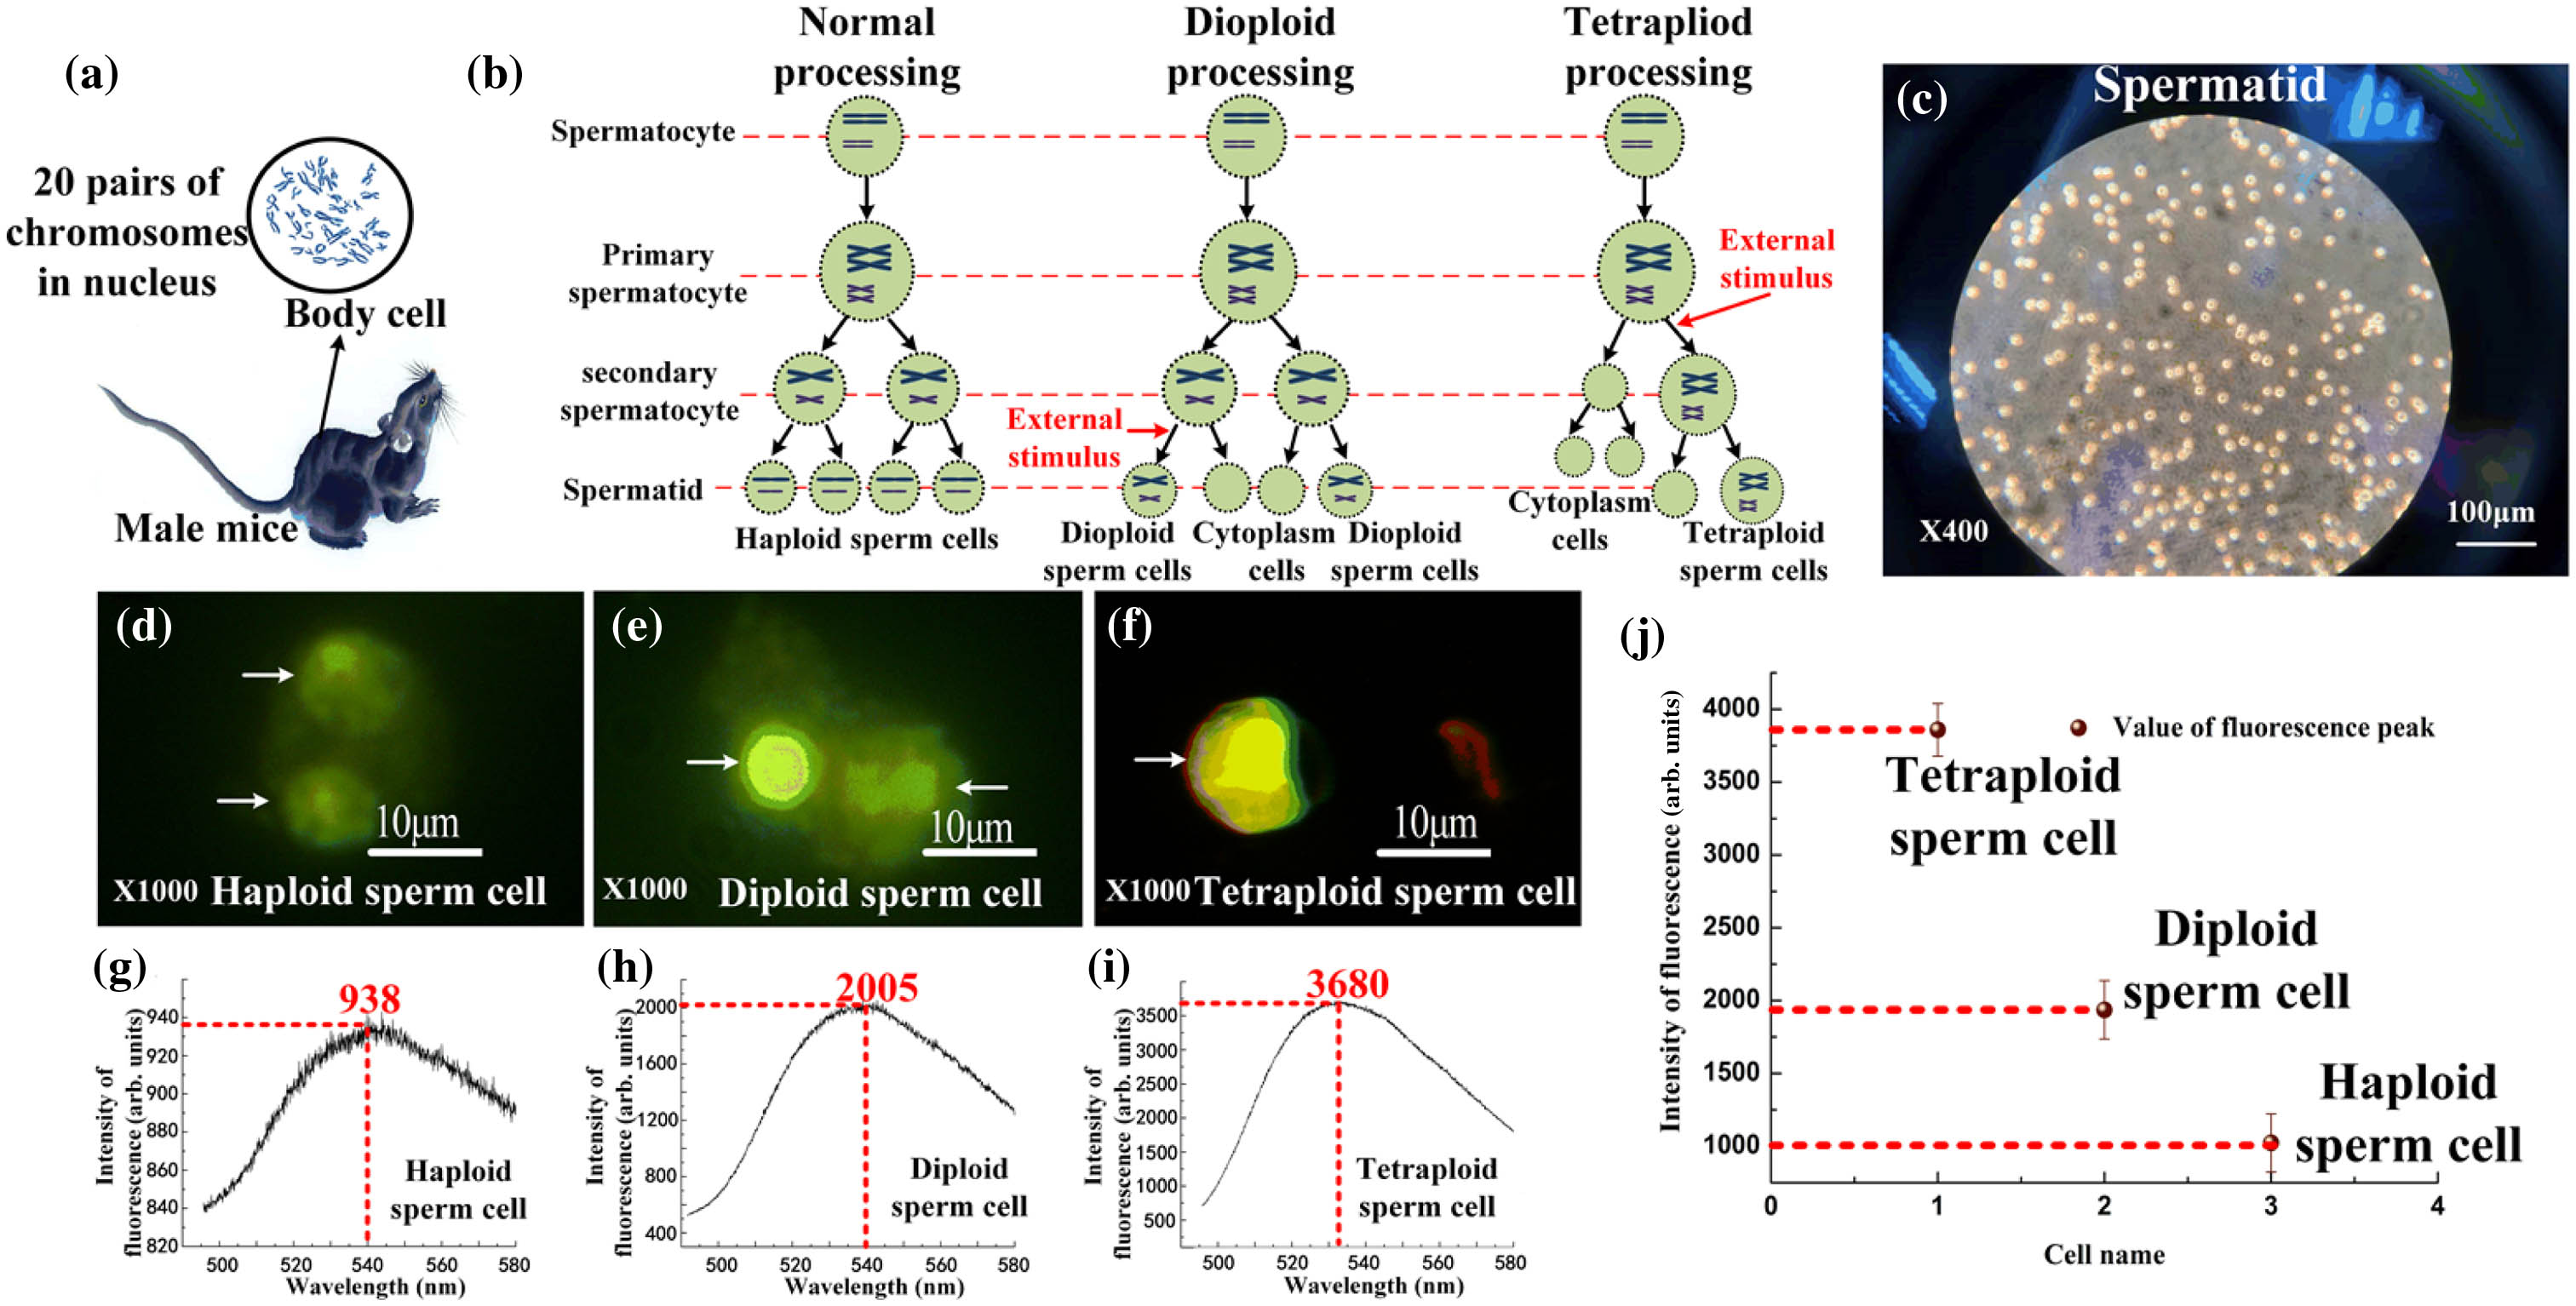
    Fig. 2. Experimental results show that the mouse’s chromosome number changes in the sperm cells. (a) Chromosome numbers of male mice. (b) Haploid sperm cells, diploid sperm cells, tetraploid sperm cells, and cytoplasm cells can be obtained from male mice spermatocyte stem cells during development and differentiation. (c) Haploid, diploid, tetraploid sperm cells, and cytoplasm cells imaged by microscope. (d)–(f) are fluorescent microscope imaging of the haploid, diploid, and tetraploid sperm cells, respectively. (g)–(i) Fluorescent intensity of the haploid, diploid, and tetraploid sperm cells, respectively. (j) Value of fluorescence peak of the haploid, diploid, and tetraploid sperm cells.
    Application of the fluorescence detection map with personalized cancer treatment to optimize therapeutic results. (a) Representative PET/CT and PET images of mice in the three groups at 5 h post-injection. All of the data represent three mice per group [26]. (b) Serial coronal PET images of 4T1 tumor-bearing mice at different time points of post-injection of the targeted drug; tumors are indicated by yellow arrowheads. (c) Chart of intensity of chromosome fluorescence after targeted drug in cancer therapy. There is no tumor in the mice by PET imaging. (d) PET images of Group 1 mice after cancer therapy without continued medication. The tumor recurrence is captured by PET 2 weeks after therapy. (e) Continued drug until the data of chromosome fluorescence intensity are between the dotted lines. (f) No tumor recurrence in Group 2 mice with continued drug in PET images under 1 and 2 weeks of observation.
    Fig. 3. Application of the fluorescence detection map with personalized cancer treatment to optimize therapeutic results. (a) Representative PET/CT and PET images of mice in the three groups at 5 h post-injection. All of the data represent three mice per group [26]. (b) Serial coronal PET images of 4T1 tumor-bearing mice at different time points of post-injection of the targeted drug; tumors are indicated by yellow arrowheads. (c) Chart of intensity of chromosome fluorescence after targeted drug in cancer therapy. There is no tumor in the mice by PET imaging. (d) PET images of Group 1 mice after cancer therapy without continued medication. The tumor recurrence is captured by PET 2 weeks after therapy. (e) Continued drug until the data of chromosome fluorescence intensity are between the dotted lines. (f) No tumor recurrence in Group 2 mice with continued drug in PET images under 1 and 2 weeks of observation.
    Experiment system and the structure declaration of waveguide. (a) Experimental setup, (b) diagram of microsyringe, (c) structure of the waveguide. Five layers from top to bottom: a 0.3-mm-thick glass slide with 35 nm silver at the top, a 10 mm×4 mm rectangular channel embedded in a 0.4-mm-thick glass slab working as sample container in the guiding layer, and another 0.3-mm-thick glass coated with 300-nm-thick silver at the bottom of the structure. These parts are optically contacted together and parallel to each other. Light is coupled into the sample channel of the fluidic waveguide. (d) The guided-wave absorbent peak (attenuating total reflection absorption peak, ATR) at coupling angle; 99% of the incident light is coupled into waveguide. (e) The coupling angle shift is due to the refractive index or the thickness of the waveguide layer.
    Fig. 4. Experiment system and the structure declaration of waveguide. (a) Experimental setup, (b) diagram of microsyringe, (c) structure of the waveguide. Five layers from top to bottom: a 0.3-mm-thick glass slide with 35 nm silver at the top, a 10  mm×4  mm rectangular channel embedded in a 0.4-mm-thick glass slab working as sample container in the guiding layer, and another 0.3-mm-thick glass coated with 300-nm-thick silver at the bottom of the structure. These parts are optically contacted together and parallel to each other. Light is coupled into the sample channel of the fluidic waveguide. (d) The guided-wave absorbent peak (attenuating total reflection absorption peak, ATR) at coupling angle; 99% of the incident light is coupled into waveguide. (e) The coupling angle shift is due to the refractive index or the thickness of the waveguide layer.
    Detection of fluorescent intensity system and stability. (a) Detection system for intensity of chromosome fluorescence. (b) Incident laser beam and divergence angle ∼0.6°, incident light spot, and reflected light spot. (c) The coupling angle is different when the number of the chromosome is different in the cell. The incident angles are 0.41°, 0.43°, and 0.45°, and the numbers 1, 2, and 3 represent haploid, diploid, and tetraploid sperm cells; the intensity of fluorescence remains stable at 0.41°, 0.43°, and 0.45°.
    Fig. 5. Detection of fluorescent intensity system and stability. (a) Detection system for intensity of chromosome fluorescence. (b) Incident laser beam and divergence angle 0.6°, incident light spot, and reflected light spot. (c) The coupling angle is different when the number of the chromosome is different in the cell. The incident angles are 0.41°, 0.43°, and 0.45°, and the numbers 1, 2, and 3 represent haploid, diploid, and tetraploid sperm cells; the intensity of fluorescence remains stable at 0.41°, 0.43°, and 0.45°.
    Hailang Dai, Hongrui Shan, Zhangchi Sun, Daopeng Dai, Yuxi Shang, Zhuangqi Cao, Xianfeng Chen. Single-cell detection by enhancement of fluorescence in waveguides for cancer diagnosis and therapy[J]. Photonics Research, 2021, 9(12): 2381
    Download Citation