
Hailang Dai, Hongrui Shan, Zhangchi Sun, Daopeng Dai, Yuxi Shang, Zhuangqi Cao, Xianfeng Chen, "Single-cell detection by enhancement of fluorescence in waveguides for cancer diagnosis and therapy," Photonics Res. 9, 2381 (2021)
- Photonics Research
- Vol. 9, Issue 12, 2381 (2021)
Abstract
1. INTRODUCTION
Malignant tumors are common and lethal [1–3]. Recurrence and metastasis are the two main problems with cancer therapy [4]. Currently, treatments for cancer can be separated into three categories: radiation, surgical removal of a tumor, and chemotherapy [5,6]. However, the cancer can recur at or near the site of the tumor or distant points [7]. Cancer recurrence can be a combination of various factors. One of the main causes is that incomplete cancer treatment results in the surviving of cancer cells in the patient’s body.
The early diagnosis and adjuvant treatment could improve the chance of killing any remaining cancer cells and reduce the risk of relapse. Early detection of recurrence during the follow-up is associated with improved survival rates in patients with early-stage cancer [8] regardless of whether they have received adjustment therapy [9]. The biomarker now is used as the standard of cure, in which a carcinoembryonic antigen (CEA) [10] has limited sensitivity. Computed tomography (CT) [11] imaging improves the detection of recurrences, but it is associated with radiation exposure and also a high false-positive rate.
Nanomedicine aims to improve the biodistribution and the target site accumulation of systemically applied chemotherapeutics. Organic dyes [12], nanoparticles [13], semiconductors [14], quantum dots [15], and other nanomaterials [16] have been extensively investigated. These systems offer a novel combination of tunable photoluminescence, excellent photostability, biocompatibility, and chemical inertness. Moreover, many routinely used (chemo)therapeutic agents suffer from poor pharmacokinetics and biodistribution. Because of their low molecular weight, for instance, intravenously administered anticancer drugs are generally rapidly cleared from the circulation (by means of renal filtration), and they do not accumulate well in tumor cells. Strong photobleaching and inferior thermal stability of conventional organic dyes as well as the cytotoxicity of nanoparticles and semiconductor quantum dots hinder practical applications. The detection of an abnormal chromosome number in cancer cells [16–19] is a signal to successful cancer treatment. Normal cells are diploid, and the cancer cell is nondiploid because of spontaneous mitotic chromosome nondisjunction in the cancer cell [16]. Different intensities of fluorescence can be detected by optical techniques due to the different chromosome number.
Sign up for Photonics Research TOC. Get the latest issue of Photonics Research delivered right to you!Sign up now
In this paper, we provide a fluorescence detection map drawn by a strong coupling waveguide, hollow-core metal-cladding optofluidic waveguide, to detect the intensity of fluorescence from a single cell and analyze the chromosome number in the cell. Our strategy is described below. First, cells with DAPI-stained chromosomes are injected into a sample channel one by one. Meanwhile, the specific ultrahigh-order modes (UOMs) in the guiding layer of the waveguide are excited by adjusting the incident angle of light to fulfill the phase-match condition [20]. Second, when cells are injected into the channel, the intensity of the fluorescence is significantly changed and monitored. Fluorescent faculae are found in the coupled area of the light spot, and the fluorescence intensity of the chromosomes can be measured at a fixed angle [21–23]. Finally, the leaked fluorescence of the single cell through the coupling layer is collected and recorded. The fluorescence intensity is proportional to the number of chromosomes. By analyzing the intensity of the leaked fluorescence, we can draw a map to distinguish the number of the chromosomes from the single cell and detect whether it is normal or not. In this way, we precisely and promptly detect the reproductive cells of male mice, lung cancer cells, and surviving cancer cells after treatment of cancer by the three categories of therapy.
2. RESULTS
A. Map Setup with Lung Cancer Cell via Chromosome Fluorescence
In a previous study [24,25], the low intensity of the fluorescence can be detected by our strong coupling waveguide. Because the different fluorescent intensities correspond to different chromosome numbers, it is possible to distinguish abnormalities by a cell’s chromosome number. Thus, we used nonsmall cell lung cancer (NSCLC) cells from a 53-year-old male whose cancer had progressed on multiple prior lines of chemotherapy and epidermal growth factor receptor tyrosine kinase inhibitors; resistance biopsy was T790M+ without evidence of the C797S mutation. The biopsies were separated and processed as cell solutions. Figure 1(a) displays the section of NSCLC cells under a microscope. Different cancer cell lines with DAPI stained chromosomes are shown in Figs. 1(b)–1(e) under a 60-fold microscope. Figure 1(f) illustrates a brief flow diagram of the separation of different cells. The separations of cells stained by DAPI are based on their sizes. The cells are divided into three groups based on their number of chromosomes. A normal group indicates two sets of chromosomes (all human beings have 46 chromosomes in 23 matching pairs [26]), whereas the abnormal group contains 23, 69, or many more chromosomes. Figures 1(g)–1(i) show the normal microscopy images, abnormal microscopy images, and chromosome fluorescent intensity, respectively.
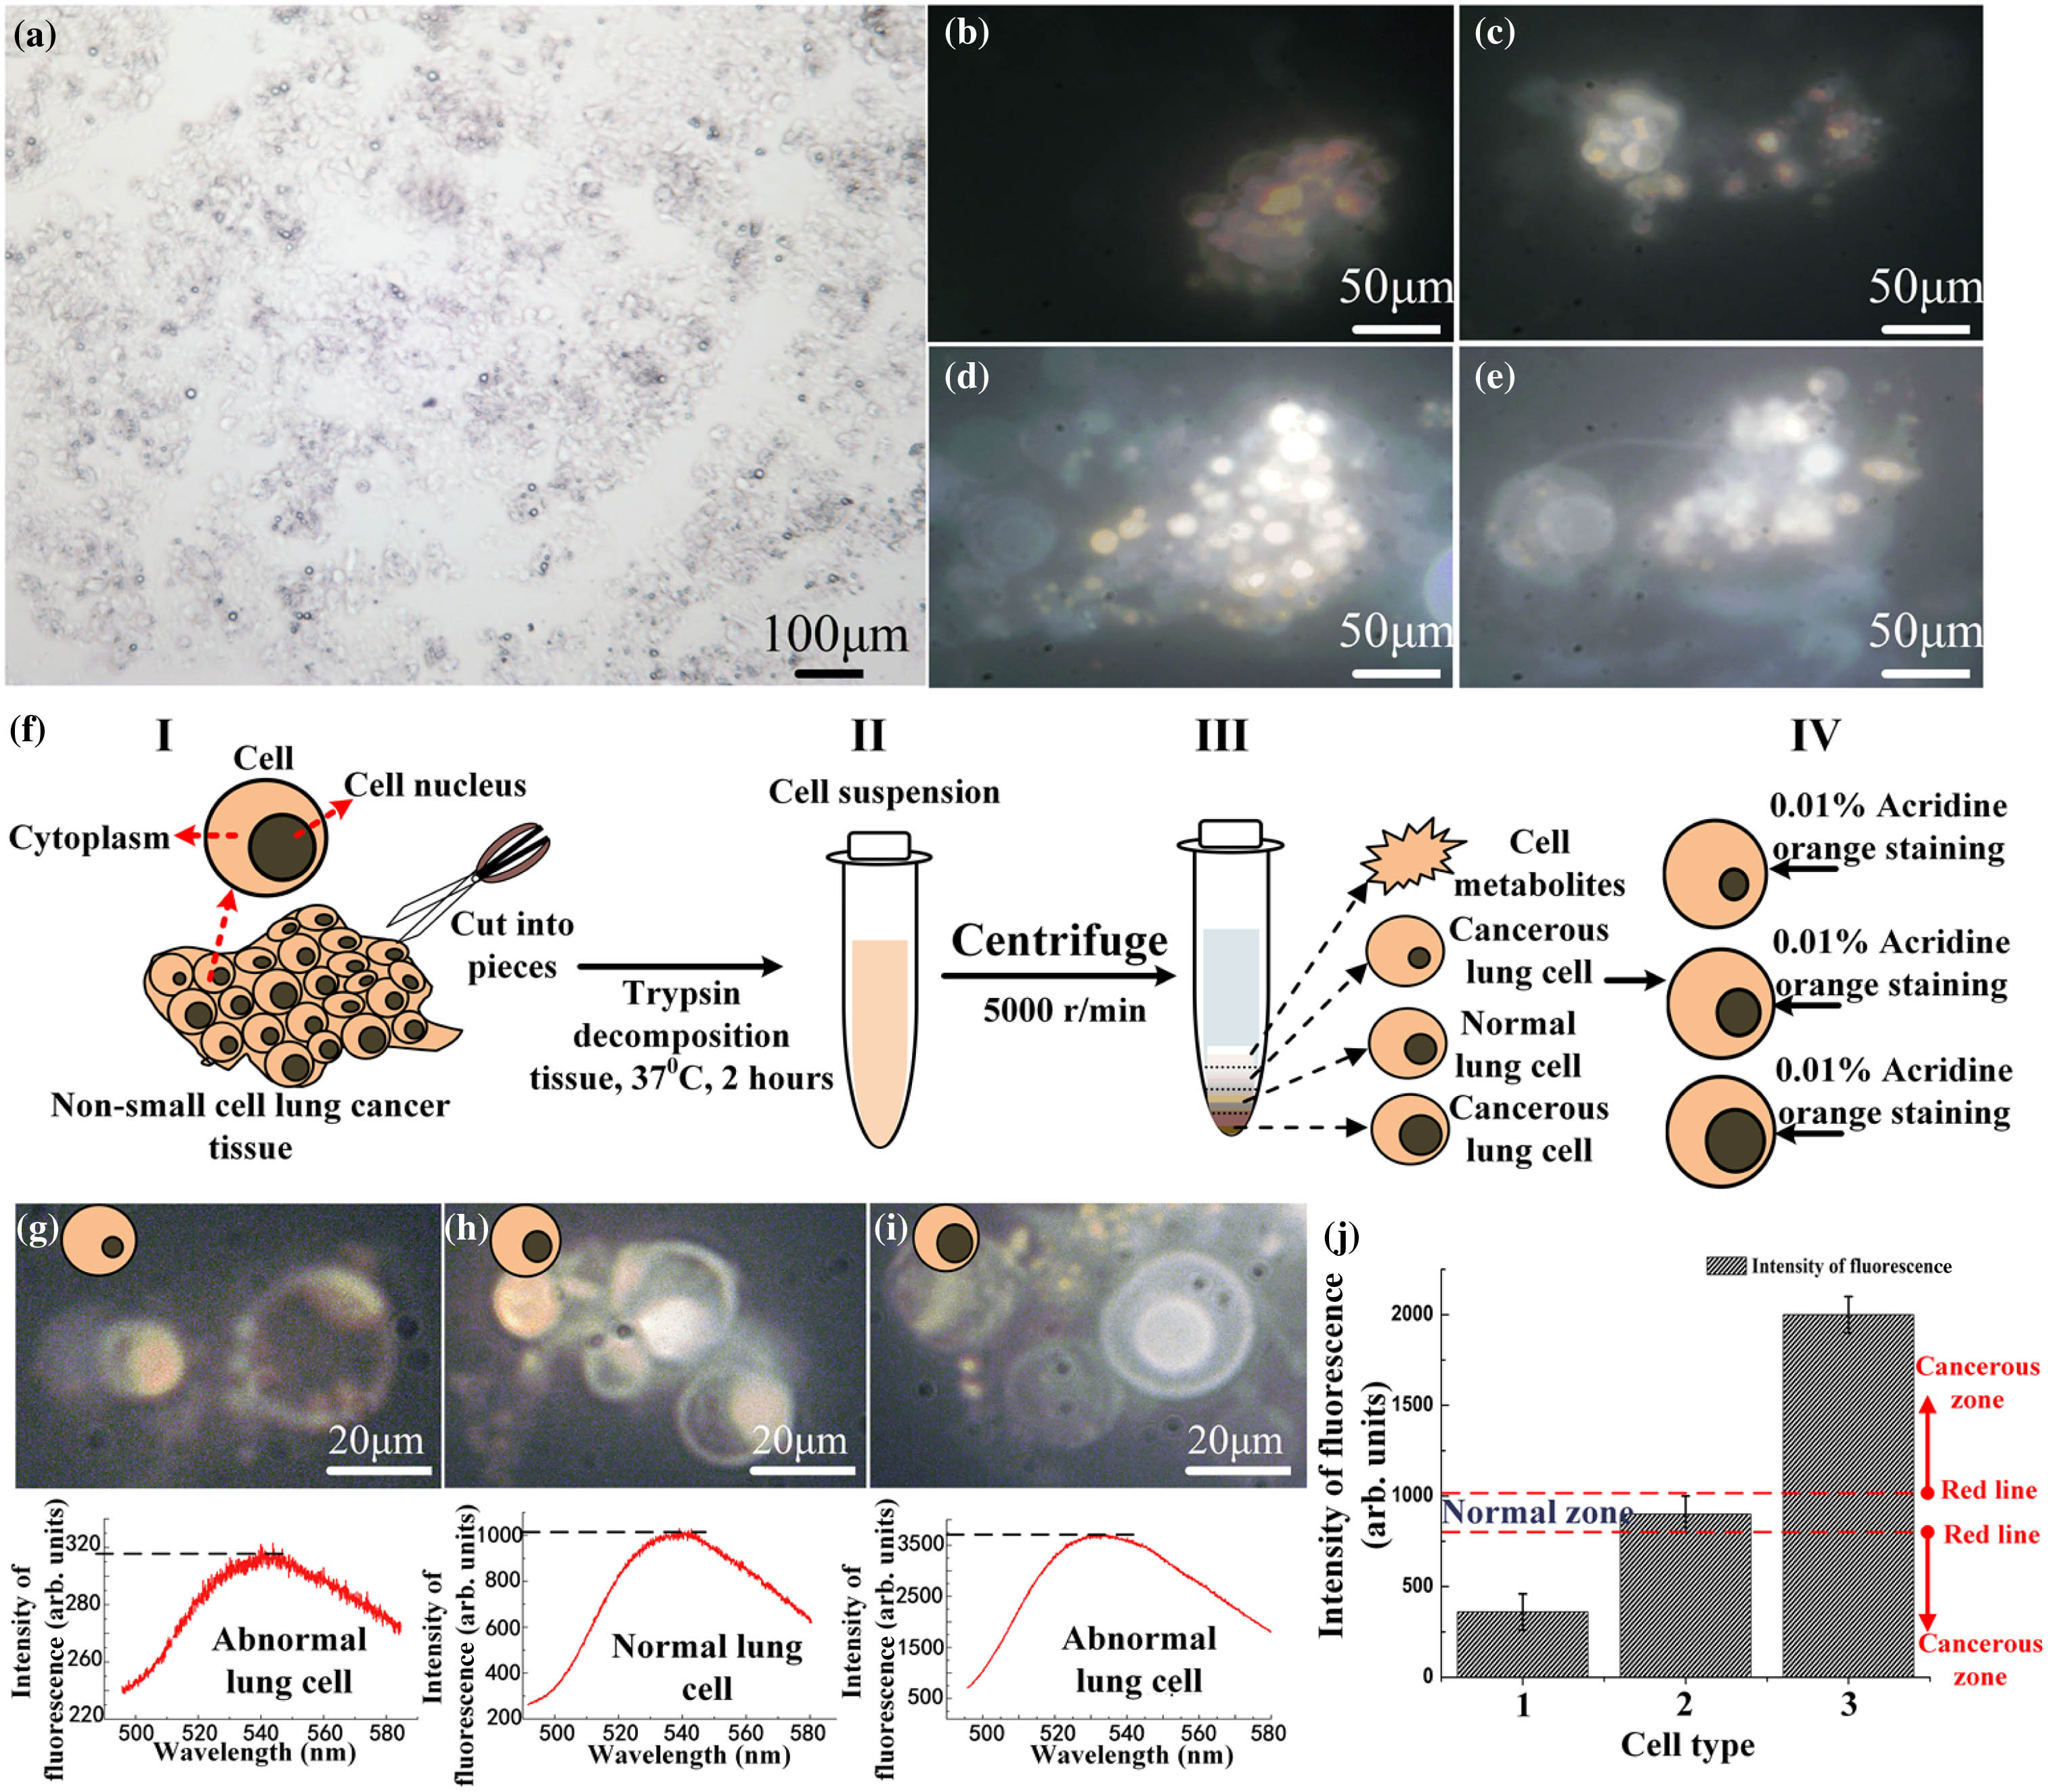
Figure 1.Detection of cancer cells via chromosome fluorescence. (a) Nonsmall cell lung cancer (NSCLC) cell is examined under a microscope to confirm the diagnosis; cells (
Based on the method described above, we succeed in discriminating the normal and lung cancer cells according to the intensity of the chromosome fluorescence [Fig. 1(j)] in the map. In the middle of the chart, there is a normal zone between the red-dotted lines: the top and bottom red-dotted lines represent the intensity of the chromosome fluorescence to be 1000 and 750, respectively. If the intensity of the measured fluorescence lies beyond this region, then the cell is likely to be abnormal. An abnormal chromosome number may suggest that the cell is cancerous.
B. Map Validation by Detection of Abnormal Spermiogenesis in Male Mice
In order to prove that our detection method can distinguish the number of chromosomes in a single cell, we use reproductive cells of male mice which have various chromosome numbers due to abnormal spermiogenesis. The reproductive cells with a normal or an abnormal number of chromosomes come from our research partner (Shanghai Key Lab of Veterinary Biotechnology, School of Agriculture and Biology, Shanghai Jiao Tong University) [27]. As shown in Figs. 2(a)–2(c), we obtain haploid, diploid, and tetraploid sperm cells. Flow cytometry evaluates the separation of different testicular reproductive cells. The separations of cells are based on their sizes. The reproductive cells (haploid, diploid, and tetraploid sperm cells) are prepared separately in a suitable concentration (
![]()
Figure 2.Experimental results show that the mouse’s chromosome number changes in the sperm cells. (a) Chromosome numbers of male mice. (b) Haploid sperm cells, diploid sperm cells, tetraploid sperm cells, and cytoplasm cells can be obtained from male mice spermatocyte stem cells during development and differentiation. (c) Haploid, diploid, tetraploid sperm cells, and cytoplasm cells imaged by microscope. (d)–(f) are fluorescent microscope imaging of the haploid, diploid, and tetraploid sperm cells, respectively. (g)–(i) Fluorescent intensity of the haploid, diploid, and tetraploid sperm cells, respectively. (j) Value of fluorescence peak of the haploid, diploid, and tetraploid sperm cells.
Figures 2(d)–2(f) show the fluorescence microscope
C. Map Application
In the validation above, we find that the method based on our strong coupling waveguide can detect chromosomal abnormalities. Moreover, it can be further used to precisely monitor the process of cancer therapy. As shown in Fig. 3, the
![]()
Figure 3.Application of the fluorescence detection map with personalized cancer treatment to optimize therapeutic results. (a) Representative PET/CT and PET images of mice in the three groups at 5 h post-injection. All of the data represent three mice per group [26]. (b) Serial coronal PET images of 4T1 tumor-bearing mice at different time points of post-injection of the targeted drug; tumors are indicated by yellow arrowheads. (c) Chart of intensity of chromosome fluorescence after targeted drug in cancer therapy. There is no tumor in the mice by PET imaging. (d) PET images of Group 1 mice after cancer therapy without continued medication. The tumor recurrence is captured by PET 2 weeks after therapy. (e) Continued drug until the data of chromosome fluorescence intensity are between the dotted lines. (f) No tumor recurrence in Group 2 mice with continued drug in PET images under 1 and 2 weeks of observation.
Meanwhile, we detect the cells from mice after therapy via our waveguide. The intensity of the chromosome fluorescence after therapy is shown in Fig. 3(c). The fluorescent data show some cells are in the abnormal zone (the top and bottom dotted lines above 1100 or below 500). Then, a proportion of these mice after therapy labeled as Group 1 are bred in highly controlled research environments for 1 week or more. The PET/CT images after 1 week [Fig. 3(d)] demonstrate that tumors recur. And another part of these mice labeled as Group 2 are with continued drug under continuous monitoring until the data of the chromosome fluorescence intensity [Fig. 3(e)] are between the dotted lines (normal region), which represents tumors are completely killed in our fluorescence detection map. Observation is continued for 1 and 2 weeks after treatment. PET/CT images after 1 and 2 weeks [Fig. 3(f)] show that the tumors disappear in Group 2. In brief, the precise and easy diagnosis of abnormal cells is useful to cancer therapy. The results show that our ultrasensitive detection of an abnormal chromosome number is useful in cancer monitoring and treatment.
3. DISCUSSION
This work reports a fluorescence detection map which can detect a single cancer cell in real time via a strong coupling waveguide. In our work, the weak intensity of the fluorescence has been enhanced by the resonance with a UOM in the waveguide, resulting in the chromosome fluorescence of a single live cell being able to be identified without a high-resolution microscope. Based on the above, we propose the method by detecting the NSCLC, which can be applied to monitor the chromosomal abnormalities. Subsequently, the different testicular reproductive cells including haploid, diploid, and tetraploid sperm cells have been distinguished with the map. According to the
4. MATERIALS AND METHODS
Authors claim: all applicable institutional and national guidelines for the care and use of animals were followed.
A. Strong Coupling Waveguide and Experimental System
The optical setup is illustrated in Fig. 4(a). The system is relatively simple due to the free space coupling technique. A computer-controlled
![]()
Figure 4.Experiment system and the structure declaration of waveguide. (a) Experimental setup, (b) diagram of microsyringe, (c) structure of the waveguide. Five layers from top to bottom: a 0.3-mm-thick glass slide with 35 nm silver at the top, a
As shown in Fig. 2(j), the different number of chromosomes can be detected by the intensity of the fluorescence change in the waveguide with a sperm cell suspension. But, if the suspension is mixed with impurities, just the detection of the refractive index may fail to distinguish the number of the chromosomes in the cell. Therefore, a method to achieve specific signals from the chromosomes in the waveguide is needed to distinguish a single normal cell and an abnormal one. The fluorescence of the chromosome is a specific signal, and the intensity of the fluorescence is related to the number of chromosomes.
As shown in Fig. 5, we detect the intensity of the fluorescence at coupling angles
![]()
Figure 5.Detection of fluorescent intensity system and stability. (a) Detection system for intensity of chromosome fluorescence. (b) Incident laser beam and divergence angle
B. Mouse Sperm Cell Preparation and the Separation of Different Testicular Cells
The mouse sperm used was previously described [28,29]. Briefly, KunMing mice (Shanghai Laboratory Animal Center of the Chinese Academy of Sciences) were used in this study. Animal experiments were performed according to the institutional guidelines for ethics (Approval number 86/609/EEC-24/11/86). All of the experimental procedures were approved by the Animal Ethics Committee of Shanghai Jiao Tong University (No. IACUC-2018-010). The housing facility is a barrier housing facility, and it is maintained according to the national standards contained in “Laboratory Animal-Requirements of Environment and Housing Facilities” (GB 14925-2001). The care of laboratory animals and the animal experimental operation conformed to the “Beijing Administration Rule of Laboratory Animals.”
We used 10 cages (at least) of newborn male mice in each experiment, and the number of newborn male mice was more than 50. Newborn male mice were randomly divided into two groups and were caged separately. Ear cropping was used to identify the Pd-treated group.
C. 4T1 Murine Breast Cancer Model
To generate the 4T1 tumor model, 4–5-week-old female Qui Gue TM-PDX mice were purchased from JNO (Jennio-bio, Guangzhou, China). Tumors were established by subcutaneously injecting
D. PET and PET/CT Imaging
PET and PET/CT scans at various time points were done post-injection using a microPET/microCT Inveon rodent model scanner (Siemens Medical Solution USA, Inc.) with 2 μm resolution. The scan space was
E. Histology
Frozen tissue slices (7 μm thickness) were fixed with cold acetone and stained for endothelial marker CD31 through the use of a rat antimouse CD31 antibody and a Cy3-labeled donkey antirat lgG. The tissue slice was also incubated with 2 μg/mL of acridine-orange-labeled goat antihuman lgG for visualization of the chromosome. All of the images were acquired with a DYF-880 fluorescent microscope.
F. Cell Culture
The cells were cultured in Dulbecco’s modified Eagle’s medium (DMEM) containing 10% FBS, penicillin (100 U/mL), and streptomycin (100 μg/mL). The cells were incubated in a humidified atmosphere with 5%
G. Other Materials
Acridine orange and Cy3-labeled secondary antibodies were purchased from Sinopharm Chemical Reagent Co., Ltd. (Shanghai, China). Absolute ethanol, sodium chloride (NaCl), and doxorubicin hydrochloride (DOX) were purchased from Fisher Scientific. Water and all buffers were of Millipore grade and pretreated with a Chelex 100 resin to ensure that the aqueous solution was free of heavy metals. All of the chemicals were used as received without further purification.
Acknowledgment
Acknowledgment. The authors acknowledge support from the State Key Laboratory of Advanced Optical Communication Systems and Networks, and also thank the Ruijin Hospital, Shanghai Jiao Tong University School of Medicine.
References
[1] D. Hanahan, R. A. Weinberg. The hallmarks of cancer. Cell, 100, 57-70(2000).
[2] S. I. Grivennikov, F. R. Greten, M. Karin. Immunity, inflammation, and cancer. Cell, 140, 883-899(2010).
[3] B. B. Aggarwal, R. V. Vijayalekshmi, B. Sung. Targeting inflammatory pathways for prevention and therapy of cancer: short-term friend, long-term foe. Clin. Cancer Res., 15, 425-430(2009).
[4] K. Raghu, R. A. Weinberg. The basics of epithelial-mesenchymal transition. J. Clin. Invest., 119, 1420-1428(2010).
[5] J. Bollrath, T. J. Phesse, V. Burstin, T. Putoczki, M. Bennecke, T. Bateman, T. Nebelsiek, T. Lundgren-May, O. Canli, S. Schwitalla, V. Matthews, R. M. Schmid, T. Kirchner, M. C. Arkan, M. Ernst, F. R. Greten. gp130-mediated Stat3 activation in enterocytes regulates cell survival and cell-cycle progression during colitis-associated tumorigenesis. Cancer Cell, 15, 91-102(2009).
[6] J. F. Bosset, L. Collette, G. Calais, L. Mineur, P. Maingon, R. J. Ljiljana, A. Daban, E. Bardet, A. Beny, J. C. Ollier. Chemotherapy with preoperative radiotherapy in rectal cancer. N. Engl. J. Med., 355, 1114-1123(2006).
[7] C. M. Ribic, D. J. Sargent, M. J. Moore, S. N. Thibodeau, A. J. French, R. M. Goldberg, S. R. Hamilton, L. P. Pierre, R. Gryfe, L. E. Shepherd, D. Tu, M. Redston, S. Gallinger. Tumor microsatellite-instability status as a predictor of benefit from fluorouracil-based adjuvant chemotherapy for colon cancer. N. Engl. J. Med., 349, 247-257(2003).
[8] H. M. Quah, J. Chou, F. Gonen, M. Shia, J. Schrag, D. Landmann, R. Guillem, G. Paty, J. Temple, P. Wong, B. Weiser. Identification of patients with high-risk stage II colon cancer for adjuvant therapy. Dis. Colon. Rectum., 51, 503-507(2008).
[9] G. P. Dunn, C. M. Koebel, R. D. Schreiber. Interferons, immunity and cancer immunoediting. Nat. Rev. Immunol., 6, 836-848(2006).
[10] S. Benchimol, A. Fuks, S. Jothy, N. Beauchemin, S. Kinji, C. P. Stanners. Carcinoembryonic antigen, a human tumor marker, functions as an intercellular adhesion molecule. Cell, 57, 327-334(1989).
[11] P. Nazerian, V. Volpicelli, B. Gigli, B. Zanobetti, I. Ermini, S. Grifoni. Accuracy of lung ultrasound for the diagnosis of consolidations when compared to chest computed tomography. Crit. Ultrasound J., 7, A13(2015).
[12] Y. Cai, W. Si, W. Huang, P. Chen, J. Shao, X. Dong. Organic dye based nanoparticles for cancer phototheranostics. Small, 14, 1704247(2018).
[13] A. B. Chinen, C. M. Guan, J. R. Ferrer, S. N. Barnaby, T. J. Merkel, C. A. Mirkin. Nanoparticle probes for the detection of cancer biomarkers, cells, and tissues by fluorescence. Chem. Rev., 115, 10530-10574(2015).
[14] P. V. Shanta, D. D. Stuart, Q. Cheng. “Graphene oxide-nanocarriers for fluorescent sensing of calcium ion accumulation and direct assessment of ion-induced enzymatic activities in cells. ACS Appl. Nano Mater., 2, 5594-5603(2019).
[15] J.-A. Huang, V. Caprettini, Y. Zhao, G. Melle, N. Maccaferri, L. Deleye, X. Zambrana-Puyalto, M. Ardini, F. Tantussi, M. Dipalo, F. D. Angelis. On-demand intracellular delivery of single particles in single cells by 3D hollow nanoelectrodes. Nano Lett., 19, 722-731(2019).
[16] Q. Shi, R. King. Chromosome nondisjunction yields tetraploid rather than aneuploid cells in human cell lines. Nature, 437, 1038-1042(2005).
[17] R. Fodde, J. Kuipers, C. Rosenberg, R. Smits, M. Kielman, C. Gaspar, H. V. E. Johan, C. Breukel, J. Wiegant, R. H. Giles, H. Clevers. Mutations in the APC tumour suppressor gene cause chromosomal instability. Nat. Cell Biol., 1, 433-438(2006).
[18] E. Hernando, Z. Nahlé, G. Juan, E. D. Rodriguez, M. Alaminos, M. Hemann, L. Michel, V. Mittal, W. Gerald, R. Benezra, S. W. Lowe, C. C. Cardo. Rb inactivation promotes genomic instability by uncoupling cell cycle progression from mitotic control. Nature, 430, 797-802(2004).
[19] P. V. Jallepalli, I. C. Waizenegger, F. Bunz, L. Sabine, M. R. Speicher, J. M. Peters, K. W. Kinzler, B. Vogelstein, C. Lengauer. Securin is required for chromosomal stability in human cells. Cell, 105, 445-457(2001).
[20] F. Chen, Z. Cao, Q. Shen, Y. Feng. Optical approach to angular displacement measurement based on attenuated total reflection. Appl. Opt., 44, 5393-5397(2005).
[21] Y. Wang, Z. Cao, T. Yu, H. Li, Q. Shen. Enhancement of the superprism effect based on the strong dispersion effect of ultrahigh-order modes. Opt. Lett., 33, 1270-1276(2008).
[22] H. Li, Z. Cao, H. Lu, Q. Shen. Free-space coupling of a light beam into a symmetrical metal-cladding optical waveguide. Appl. Phys. Lett., 83, 2757-2759(2003).
[23] W. Yi, Z. Cao, H. Li, Q. Shen, W. Yuan, P. Xiao. Tunable polarization beam splitting based on a symmetrical metal-cladding waveguide structure. Opt. Express, 17, 13157-13167(2009).
[24] H. Dai, C. Yin, X. Ye, B. Jiang, M. Ran, Z. Cao, X. Chen. A possible pathogenetic factor of sickle-cell disease based on fluorescent analysis via an optofluidic resonator. Sci. Rep., 7, 3174(2017).
[25] J. Bei, H. Dai, X. Chen. Enhancement of stimulated emission by a metallic optofluidic resonator. Photon. Res., 6, 597-600(2018).
[26] Q. Deng, X. Yu, S. Deng, H. Ye, Y. Zhang, W. Han, J. Li, Y. Yu. Midkine promotes articular chondrocyte proliferation through the MK-LRP1-nucleolin signaling pathway–sciencedirect. Cell. Signal., 65, 109423(2020).
[27] Q. Yang, X. Liu, J. Chen, Y. Wen, H. Liu, Z. Peng, R. Yeerken, L. Wang, X. Li. Lead-mediated inhibition of lysine acetylation and succinylation causes reproductive injury of the mouse testis during development. Toxicol. Lett., 318, 30-43(2020).
[28] X. Li, L. Wang, Y. Li, J. Fu, L. Zhen, Q. Yang, S. Li, Y. Zhang. Tyrosine phosphorylation of dihydrolipoamide dehydrogenase as a potential cadmium target and its inhibitory role in regulating mouse sperm motility. Toxicology, 357–358, 52-64(2016).
[29] Q. Yang, P. Li, Y. Wen, S. Li, J. Chen, X. Liu, L. Wang, X. Li. Cadmium inhibits lysine acetylation and succinylation inducing testicular injury of mouse during development. Toxicol. Lett., 291, 112-120(2018).
[30] D. S. P. Fabricia, M. A. S. Diamante, D. Heidi. Testis response to low doses of cadmium in Wistar rats. Int. J. Exp. Pathol., 91, 125-131(2010).
[31] J. Zhang, H. A. S. Cao, Y. Zhang, Y. Zhang, J. Ma, J. Wang, Y. Gao, X. Zhang, F. Zhang, L. Chu. Nephroprotective effect of calcium channel blockers against toxicity of lead exposure in mice. Toxicol. Lett., 218, 273-280(2013).
[32] A. R. Bellvé, C. F. Millette, Y. M. Bhatnagar, D. A. O’Brien. Dissociation of the mouse testis and characterization of isolated spermatogenic cells. J. Histochem. Cytochem., 25, 480-494(1977).


Set citation alerts for the article
Please enter your email address

© Copyright 2018-2021 | Chinese Laser Press. All Rights Reserved 沪ICP备15018463号-20