
Xiubao Hua, Rongzhu Zhang. Application of Improved Demodulation Methods Based on Phase-Generated Carrier in Laser Heterodyne Speech System[J]. Acta Optica Sinica, 2022, 42(16): 1607001
- Acta Optica Sinica
- Vol. 42, Issue 16, 1607001 (2022)
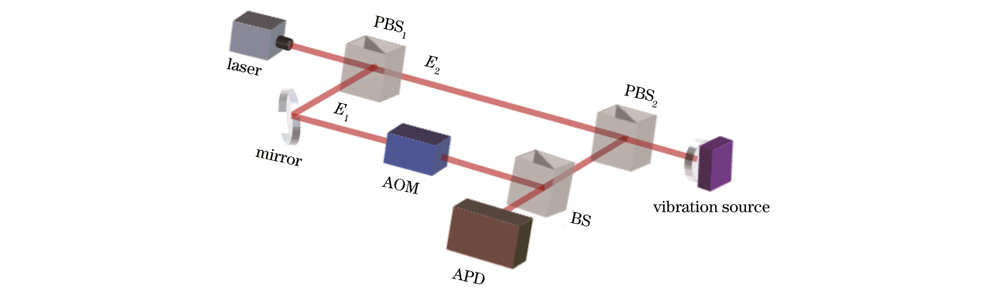
Fig. 1. Optical path diagram of laser heterodyne speech system
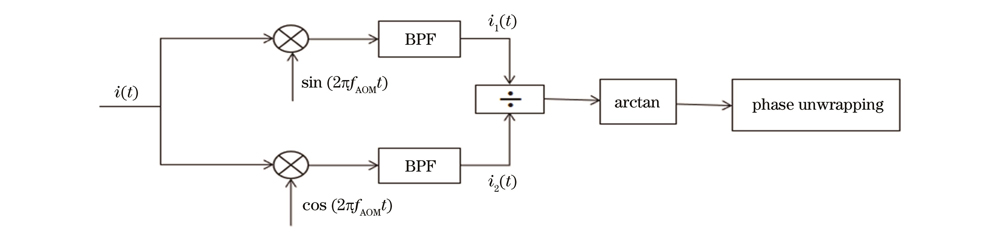
Fig. 2. Schematic diagram of arctangent demodulation
Fig. 3. Schematic diagram of differential cross multiplication demodulation
Fig. 4. Time domain diagram and spectrum of received signal. (a) Time domain diagram; (b) spectrum
Fig. 5. Time domain diagrams of signals filtered by bandpass filter. (a) Signal
Fig. 6. Demodulation results at different sampling rates. (a) 85 MHz; (b) 200 MHz
Fig. 7. Time domain diagrams of two signals after mixing and filtering. (a) Signal
Fig. 8. Demodulation results of proposed methods. (a) Arctangent; (b) differential cross multiplication
Fig. 9. Absolute error distribution after demodulation by different improved methods. (a) Arctangent; (b) differential cross multiplication
Fig. 10. Corresponding curve of analog speech signal SNR and demodulated signal SNR
|
Table 1. Demodulation results of different methods at sampling rate of 85 MHz
|
Table 2. Demodulation results of different methods at sampling rate of 200 MHz

Set citation alerts for the article
Please enter your email address
© Copyright 2018-2021 | Chinese Laser Press. All Rights Reserved 沪ICP备15018463号-20