• Spectroscopy and Spectral Analysis
  • Vol. 42, Issue 3, 924 (2022)
Yu-zhe TANG*, Mei HONG, Jia-yong HAO, Xu WANG, He-jing ZHANG, Wei-jian ZHANG, and Fei LI*;
Author Affiliations
  • College of Grassland, Resources and Environment, Inner Mongolia Agricultural University, Inner Mongolia Key Laboratory of Soil Quality and Nutrient Resources, Inner Mongolia Agricultural University, Huhhot 010018, China
  • show less
    DOI: 10.3964/j.issn.1000-0593(2022)03-0924-09 Cite this Article
    Yu-zhe TANG, Mei HONG, Jia-yong HAO, Xu WANG, He-jing ZHANG, Wei-jian ZHANG, Fei LI. Estimation of Chlorophyll Content in Maize Leaves Based on Optimized Area Spectral Index[J]. Spectroscopy and Spectral Analysis, 2022, 42(3): 924 Copy Citation Text show less
    Descriptive statistics of leaf SPAD values in different growth stages of maize
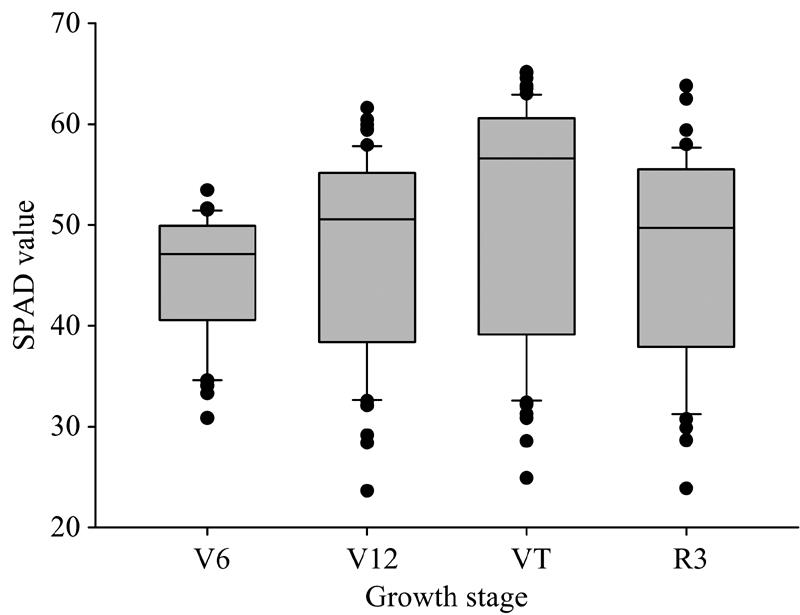
    Fig. 1. Descriptive statistics of leaf SPAD values in different growth stages of maize
    Contour maps of the coefficient of determination (R2) between leaf chlorophyll content and OCAI index(a): V6 stage; (b): V12 stage; (c): VT stage; (d): R3 stage
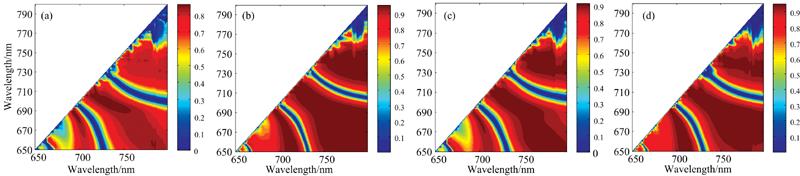
    Fig. 2. Contour maps of the coefficient of determination (R2) between leaf chlorophyll content and OCAI index
    (a): V6 stage; (b): V12 stage; (c): VT stage; (d): R3 stage
    Contour maps of the coefficient of determination (R2) between leaf chlorophyll content and OTVI index(a): V6 stage; (b): V12 stage; (c): VT stage; (d): R3 stage
    Fig. 3. Contour maps of the coefficient of determination (R2) between leaf chlorophyll content and OTVI index
    (a): V6 stage; (b): V12 stage; (c): VT stage; (d): R3 stage
    Contour maps of the coefficient of determination (R2) between leaf chlorophyll content and ONDDA index
    Fig. 4. Contour maps of the coefficient of determination (R2) between leaf chlorophyll content and ONDDA index
    The linear relationship between leaf chlorophyll contents in four growth stages and the top 6 spectral indices of estimation ability
    Fig. 5. The linear relationship between leaf chlorophyll contents in four growth stages and the top 6 spectral indices of estimation ability
    Comparison between observed and predicted leaf chlorophyll contents based on six spectral indices
    Fig. 6. Comparison between observed and predicted leaf chlorophyll contents based on six spectral indices
    The sensitive bands of OCAI, OTVI and ONDDA at different growth stages
    Fig. 7. The sensitive bands of OCAI, OTVI and ONDDA at different growth stages
    光谱指数算法参考文献
    三角形面积指数
    Triangular greenness index (TGI)-0.5[(670-480)(R670-R550)-(670-550)(R670-R480)]Hunt et al. (2013)
    Triangular chlorophyll index (TCI)1.2(R700-R550)-1.5(R670-R550)(R700/R670)0.5Haboudane et al. (2008)
    Triangle vegetation index (TVI)0.5×[120×(R750-R550)-200×(R670-R550)]Broge and Leblanc (2000)
    Modified triangular vegetation index 1 (MTVI1)1.2×[1.2×(R800-R550)-200×(R670-R550)]Haboudane et al.(2004)
    Modified triangular vegetation index 2 (MTVI2)1.5×[1.2×(R800-R500)-2.5×(R670-R550)](2×R800+1)2-(6×R800-5×R670)-0.5Haboudane et al. (2004)
    Optimized triangle vegetation index(OTVI)0.5×[(λ2-550)×(1-2)-(2-R550)×(λ1-λ2)][1]Li et al. (2013)
    叶绿素吸收面积指数
    Chlorophyll absorption ratio index (CARI)[R700×abs(a×670+R670+b)]/R670×(a2+1)0.5[2]Kim et al. (1994)
    Modified chlorophyll absorption reflectance index (MCARI)[(R700-R670)-0.2(R700-R550)](R700/R670)Daughtry et al. (2000)
    Modified chlorophyll absorption reflectance index 1 (MCARI1)1.2×[2.5×(R800-R670)-1.3×(R800-R550)]Haboudane et al. (2004)
    Modified chlorophyll absorption reflectance index 2 (MCARI2)1.2×[2.5×(R800-R670)-1.3×(R800-R550)](2×R800+1)2-(6×R800-5×R670)-0.5Haboudane et al. (2004)
    MCARI (705, 750)[(R750-R705)-0.2(R750-R550)](R750/R705)Wu et al. (2008)
    Transformed chlorophyll absorption reflectance index (TCARI)3×[(R700-R670)-0.2(R700-R550)(R700/R670)]Haboudane et al. (2002)
    TCARI (750, 705)3×[(R750-R705)-0.2(R750-R550)(R750/R705)]Wu et al. (2008)
    Red-edge absorption chlorophyll area(RECA)680780RR780Ren et al. (2011)
    Red-edge absorption valley area (REA)1/2×(R680+Δλ-R680)×Δλ[3]Guo et al. (2017)
    Optimized red-edge absorption valley area (OREA)15×(3×R760 -R550)-20×(R680+2R720)Wen et al. (2020)
    Normalized area over reflectance curve (NAOC)1-abρdλρmax(b-a)[4]Delegido et al. (2010)
    Chlorophyll absorption integral (CAI)600735RsiRei[5]N. Oppelt et al. (2007)
    Optimized Chlorophyll absorption integral (OCAI)EFRsiRei[6]This study
    波形变换指数
    Area under curve Normamised to Maximal Band(ANMB)AUC500-800/MBD500-800Malenovsky et al. (2006)
    Double-peak canopy nitrogen index (DCNI)(R720-R700)/(R700-R670)/(R720-R670+0.03)Chen et al. (2010)
    Optimized double-peak canopy nitrogen index (ODCNI)(R720-R700)/(R700-R670)/(R720-R670+n); n=[-1∶1]This study
    Difference index of the double-peak areas(DIDA)(R755+R680-3×R718)/(R755-R680)Feng et al. (2014)
    Ratio index of the double-peak areas(RIDA)RSDRLSDRFeng et al. (2014)
    Double-peak areas based on REP division(NDDA)(R755+R680-2×RREPig)/(R755-R680)Feng et al. (2014)
    Optimized double-peak areas based on REP division(ONDDA)D675D720-D721D750/D675D750This study
    Table 1. Spectral indices
    EXP.1EXP.2EXP.3
    V6V12VTR3AllV12VTR3AllVTAll
    基于三角形面积的光谱指数
    TGI0.830.900.950.950.920.950.930.950.940.950.94
    TCI0.810.870.910.920.880.950.900.920.910.890.89
    TVI0.350.620.860.740.590.590.560.740.610.830.60
    MTVI10.370.650.850.750.620.610.550.780.630.840.63
    MTVI20.650.910.940.940.850.880.920.930.910.930.87
    OTVI0.850.940.980.950.950.900.950.970.940.950.95
    基于叶绿素吸收面积的光谱指数
    CARI0.700.350.900.930.650.920.920.930.910.890.87
    MCARI0.800.870.870.890.850.940.880.910.900.860.87
    MCARI10.570.660.850.750.620.610.550.790.630.840.63
    MCARI20.650.910.940.950.850.880.920.930.910.930.87
    MCARI(705, 750)0.670.830.960.930.860.830.900.950.880.950.87
    TCARI0.800.870.940.940.900.950.920.940.930.920.92
    TCARI(750, 705)0.370.560.890.710.670.810.850.710.790.860.73
    RECA0.580.730.930.930.810.850.880.940.880.930.84
    CAI0.380.560.820.880.630.930.890.890.880.880.67
    REA0.760.880.950.920.890.860.920.900.890.930.89
    NAOC0.810.900.970.950.930.920.950.960.940.940.91
    OREA0.810.890.970.950.920.890.830.960.920.950.92
    OCAI0.820.910.960.950.920.940.950.960.940.950.93
    基于波形变换的光谱指数
    ANMB0.690.800.940.950.860.690.880.940.940.930.89
    DCNI0.640.750.930.910.830.860.930.800.850.920.84
    DIDA0.790.880.970.960.920.920.950.950.940.960.85
    RIDA0.800.870.960.930.890.870.930.880.890.970.93
    NDDA0.820.890.950.950.920.950.910.920.910.920.88
    ODCNI0.650.770.940.920.840.870.940.810.860.930.85
    ONNDA0.880.940.990.980.960.970.970.970.960.980.96
    Table 2. Coefficient of determination (R2) of the linear relationships between leaf chlorophyll content and spectral indices in different growth stages
    Spectral indexR2RMSENRMSE/%Slope
    TGI0.9282.5434.5850.917
    TCARI0.9122.7945.0770.907
    ANMB0.8453.9517.0990.951
    OTVI0.9362.4034.1160.973
    OCAI0.9392.3594.0120.922
    ONDDA0.9432.2853.9380.996
    Table 3. Characteristics of the regression between observed and estimated SPAD values
    Yu-zhe TANG, Mei HONG, Jia-yong HAO, Xu WANG, He-jing ZHANG, Wei-jian ZHANG, Fei LI. Estimation of Chlorophyll Content in Maize Leaves Based on Optimized Area Spectral Index[J]. Spectroscopy and Spectral Analysis, 2022, 42(3): 924
    Download Citation