• Spectroscopy and Spectral Analysis
  • Vol. 40, Issue 11, 3443 (2020)
Si-han ZHOU1、1、*, Xin-yu HU1、1, Bin TANG1、1, Ming-fu ZHAO1、1, Feng-xiao LI1、1, Ren-jie WANG1、1, Qi-sen XIAO1、1, and Yu XIAO1、1
Author Affiliations
  • 1[in Chinese]
  • 11. Key Laboratory of Modern Optoelectronic Detection Technology and Instrument, Chongqing University of Technology, Chongqing 400054, China
  • show less
    DOI: 10.3964/j.issn.1000-0593(2020)11-3443-08 Cite this Article
    Si-han ZHOU, Xin-yu HU, Bin TANG, Ming-fu ZHAO, Feng-xiao LI, Ren-jie WANG, Qi-sen XIAO, Yu XIAO. Application Research of Normalization Algorithm Based on EWMA-PCA in Standardization of Water Quality Spectral Data[J]. Spectroscopy and Spectral Analysis, 2020, 40(11): 3443 Copy Citation Text show less
    UV-Visible spectrum water quality detection system block diagram
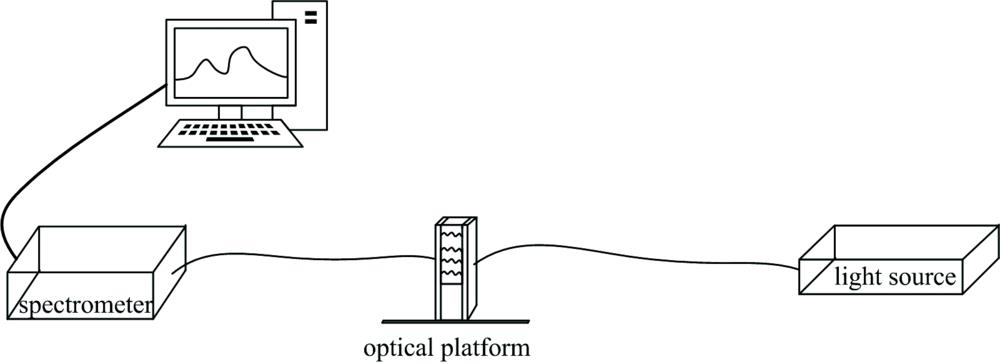
    Fig. 1. UV-Visible spectrum water quality detection system block diagram
    Spectra of 8 standard sample solutions measured under three spectrometers(a) Hamamatsu C10082CAH spectrometer;(b): Ocean Maya 200Pro spectrometer;(c): Optosky ATP2000 spectrometer
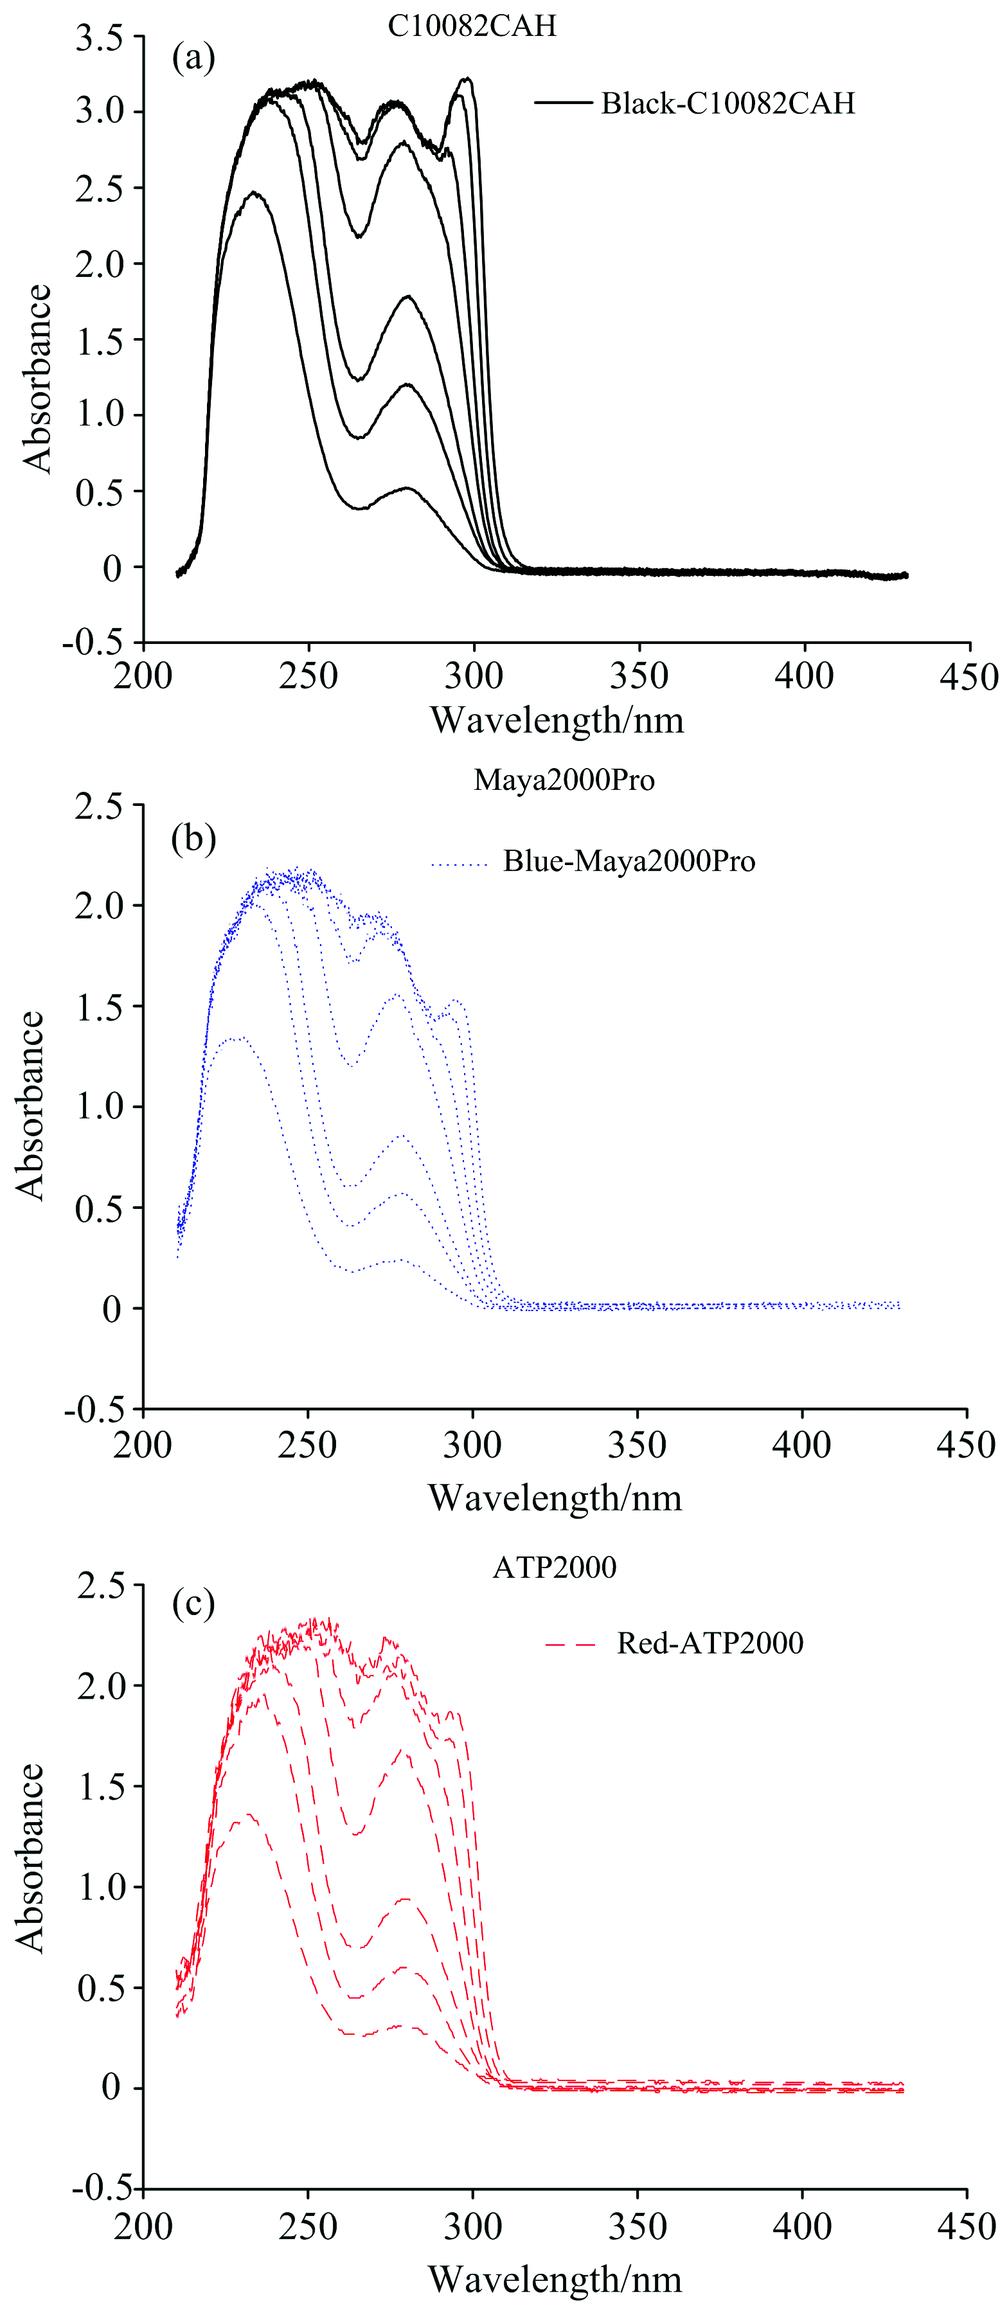
    Fig. 2. Spectra of 8 standard sample solutions measured under three spectrometers
    (a) Hamamatsu C10082CAH spectrometer;(b): Ocean Maya 200Pro spectrometer;(c): Optosky ATP2000 spectrometer
    Water quality spectral data of 8 groups of potassium hydrogen phthalate solution(a): COD 20 mg·L-1; (b): COD 40 mg·L-1; (c): COD 60 mg·L-1; (d): COD120 mg·L-1;(e): COD 160 mg·L-1; (f): COD 200 mg·L-1; (g): COD 400 mg·L-1; (h): COD 801 mg·L-1
    Fig. 3. Water quality spectral data of 8 groups of potassium hydrogen phthalate solution
    (a): COD 20 mg·L-1; (b): COD 40 mg·L-1; (c): COD 60 mg·L-1; (d): COD120 mg·L-1;(e): COD 160 mg·L-1; (f): COD 200 mg·L-1; (g): COD 400 mg·L-1; (h): COD 801 mg·L-1
    Three sets of comparison experiments to determine the normalized data of water absorption spectra of each concentration(a): Comparison 1; (b): Comparison 2; (c): Comparison 3
    Fig. 4. Three sets of comparison experiments to determine the normalized data of water absorption spectra of each concentration
    (a): Comparison 1; (b): Comparison 2; (c): Comparison 3
    Standardized evaluation of water absorption spectra of each concentration measured by three sets of comparison experiments(a): Correlation coefficient; (b): Variance; (c): Peak offset
    Fig. 5. Standardized evaluation of water absorption spectra of each concentration measured by three sets of comparison experiments
    (a): Correlation coefficient; (b): Variance; (c): Peak offset
    Concentration
    /(mg·L-1)
    Correlation CoefficientVariancePeak offset/%
    OriginalStandardizedOriginalStandardized
    200.994 2290.994 2290.098 5940.001 0160.010 8
    400.990 7520.990 7660.131 1400.001 9030.035 4
    600.986 1160.986 1280.161 7820.003 5920.002 8
    1200.989 1710.989 1730.239 2280.004 0280.097 7
    1600.991 6220.991 6230.252 8410.003 5400.006 6
    2000.991 2550.991 2560.256 9690.003 6590.073 6
    4000.985 5240.985 5240.286 1550.005 7890.009 5
    8000.982 1700.982 1700.305 7030.006 3570.070 9
    Table 1. Standardized evaluation of water absorption spectrum data measured by C10082CAH and Maya2000Pro spectrometer
    Concentration
    /(mg·L-1)
    Correlation CoefficientVariancePeak offset/%
    OriginalStandardizedOriginalStandardized
    200.991 3210.991 4370.107 9190.001 4620.010 6
    400.992 4460.992 4600.145 5160.001 7860.031 7
    600.989 6500.989 6740.162 7020.003 0060.011 4
    1200.989 9490.990 0010.210 1020.004 3730.054 0
    1600.993 3320.993 3810.210 9970.003 6530.029 0
    2000.994 0650.994 1070.205 0690.003 2620.029 0
    4000.992 0170.992 0580.209 1950.003 5760.032 3
    8000.990 7670.990 8200.198 6350.003 2910.000 5
    Table 2. Standardized evaluation of water absorption spectrum data measured by C10082CAH spectrometer and ATP2000 spectrometer
    Concentration
    /(mg·L-1)
    Correlation CoefficientVariancePeak offset/%
    OriginalStandardizedOriginalStandardized
    200.995 2360.995 2670.001 5740.000 8410.021 5
    400.995 6800.995 7070.003 4610.000 8230.003 7
    600.995 2780.995 3040.004 1070.001 0050.014 2
    1200.995 4010.995 4180.006 5400.001 3010.043 7
    1600.995 7520.995 7650.007 5560.001 3380.022 4
    2000.995 5400.995 5500.009 0440.001 4940.044 6
    4000.994 1920.994 2000.013 6500.002 0870.022 8
    8000.991 8490.991 8570.022 3980.003 0490.003 7
    Table 3. Standardized evaluation of water absorption spectrum data measured by Maya2000Pro and ATP2000 spectrometer
    Si-han ZHOU, Xin-yu HU, Bin TANG, Ming-fu ZHAO, Feng-xiao LI, Ren-jie WANG, Qi-sen XIAO, Yu XIAO. Application Research of Normalization Algorithm Based on EWMA-PCA in Standardization of Water Quality Spectral Data[J]. Spectroscopy and Spectral Analysis, 2020, 40(11): 3443
    Download Citation