
Zhenzhen Hu, Hanming Liu, Zi Li, Zenan Li, Gang Guo, Shen Sima. Study on Lock-In Imaging Technology Expansion for Background Light Elimination[J]. Laser & Optoelectronics Progress, 2023, 60(14): 1411003
- Laser & Optoelectronics Progress
- Vol. 60, Issue 14, 1411003 (2023)
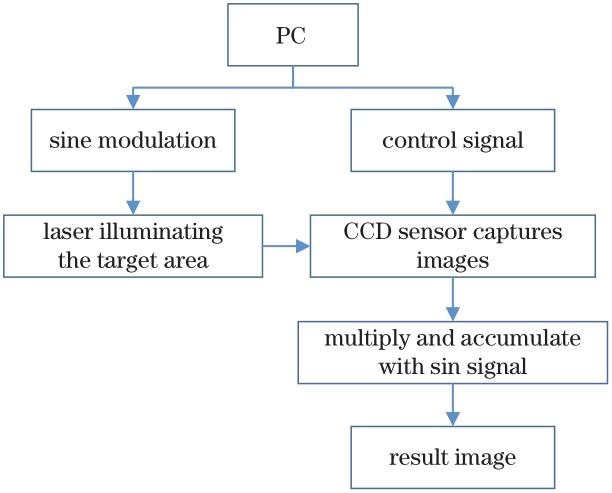
Fig. 1. Framework of lock-in imaging technology

Fig. 2. Schematic of image sampling time. (a) Equal interval sampling; (b) unequal interval sampling
Fig. 3. Light modulating system (scene 1)
Fig. 4. Flowchart of image acquisition (dotted and solid lines represent PC and MCU, respectively)
Fig. 5. Flowchart of image phase discrimination
Fig. 6. Curve of current-light intensity (DAC is the input value of the digital-to-analog converter corresponding to the current)
Fig. 7. Fitting of current-light intensity (solid is the fitting line)
Fig. 8. Examples of lighting patterns
Fig. 9. Unnormalized pixel mean of background light removed image. (a) Scene 1; (b) scene 2
Fig. 10. Eliminating background light by LED lock-in imaging. (a) Brightness-enhanced image with background light; (b) image without background light; (c) image of eliminated background light without normalization; (d) image of eliminated background light
Fig. 11. Results of eliminated background light by sine modulation
Fig. 12. Results of eliminated background light by square modulation
Fig. 13. Results of eliminated background light by triangular modulation
Fig. 14. Results of eliminated background light by sawtooth modulation
Fig. 15. Images processed by different methods. (a) Brightness-enhanced image with background light; (b) brightness-enhanced image of eliminated background light by bilateral filtering; (c) image of eliminated background light by HDR imaging; (d) image of eliminated background light by lock-in imaging technology based on LED
|
Table 1. Average running time of phase discrimination
|
Table 2. SSIM of eliminated background light image to image without/with background light
|
Table 3. Resolution of the resulting image

Set citation alerts for the article
Please enter your email address
© Copyright 2018-2021 | Chinese Laser Press. All Rights Reserved 沪ICP备15018463号-20