• Photonics Research
  • Vol. 9, Issue 6, 929 (2021)
Yangyang Liu1, Shima Gholam-Mirzaei1, John E. Beetar1, Jonathan Nesper1, Ahmed Yousif2, M. Nrisimhamurty1, and Michael Chini1、2、*
Author Affiliations
  • 1Department of Physics, University of Central Florida, Orlando, Florida 32816, USA
  • 2CREOL, The College of Optics and Photonics, University of Central Florida, Orlando, Florida 32816, USA
  • show less
    DOI: 10.1364/PRJ.420916 Cite this Article Set citation alerts
    Yangyang Liu, Shima Gholam-Mirzaei, John E. Beetar, Jonathan Nesper, Ahmed Yousif, M. Nrisimhamurty, Michael Chini. All-optical sampling of few-cycle infrared pulses using tunneling in a solid[J]. Photonics Research, 2021, 9(6): 929 Copy Citation Text show less
    (a) Mechanism of solid-state TIPTOE, in which electrons are excited by multiphoton absorption or field-induced tunneling (not shown) from the valence band to the conduction band, followed by relaxation on picosecond to nanosecond time scales and band fluorescence emission. (b) Schematic of the experimental setup for solid-state TIPTOE. The inset shows a typical band fluorescence spectrum.
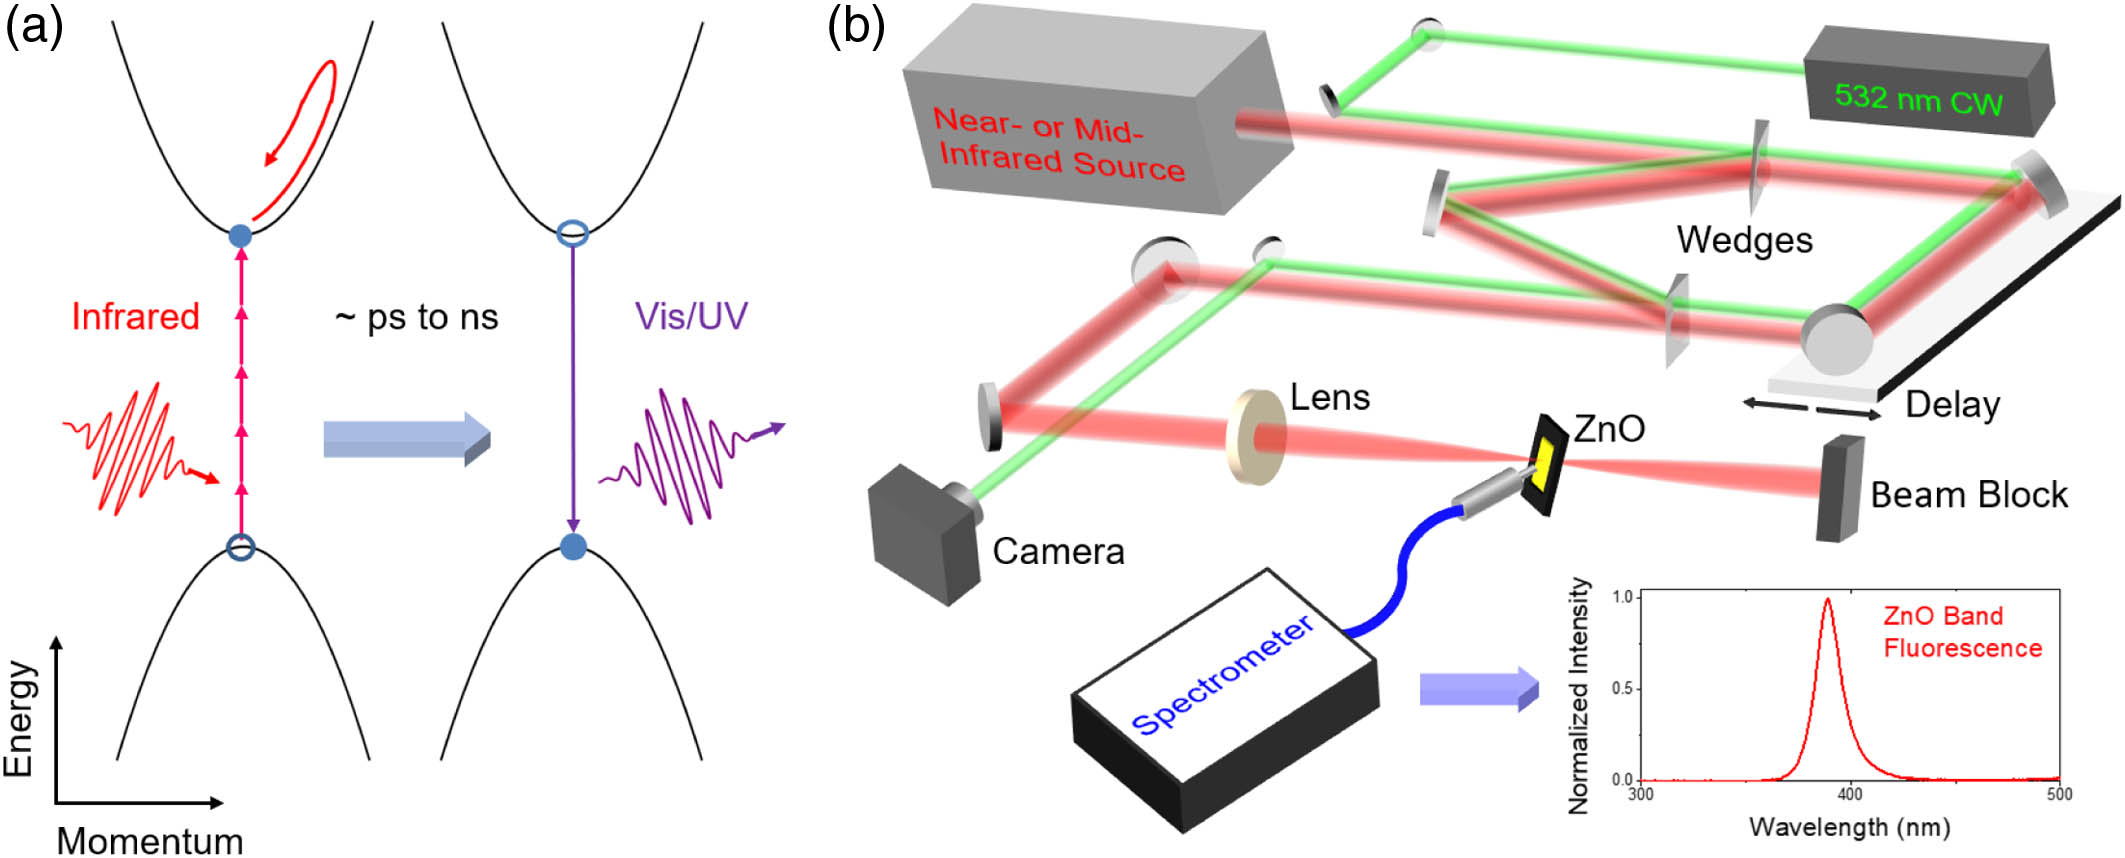
    Fig. 1. (a) Mechanism of solid-state TIPTOE, in which electrons are excited by multiphoton absorption or field-induced tunneling (not shown) from the valence band to the conduction band, followed by relaxation on picosecond to nanosecond time scales and band fluorescence emission. (b) Schematic of the experimental setup for solid-state TIPTOE. The inset shows a typical band fluorescence spectrum.
    Mid-infrared pulse characterization by solid-state TIPTOE. (a), (c), (e) Modulation of band fluorescence signal obtained with a delay step size of 0.4 fs; (b), (d), (f) measured spectrum (shaded area), retrieved spectrum (solid line), and retrieved spectral phase (dashed line). The four spectra in panel (d) were obtained from four solid-state TIPTOE scans recorded consecutively under similar experimental conditions, and show the reproducibility of the retrieved spectrum.
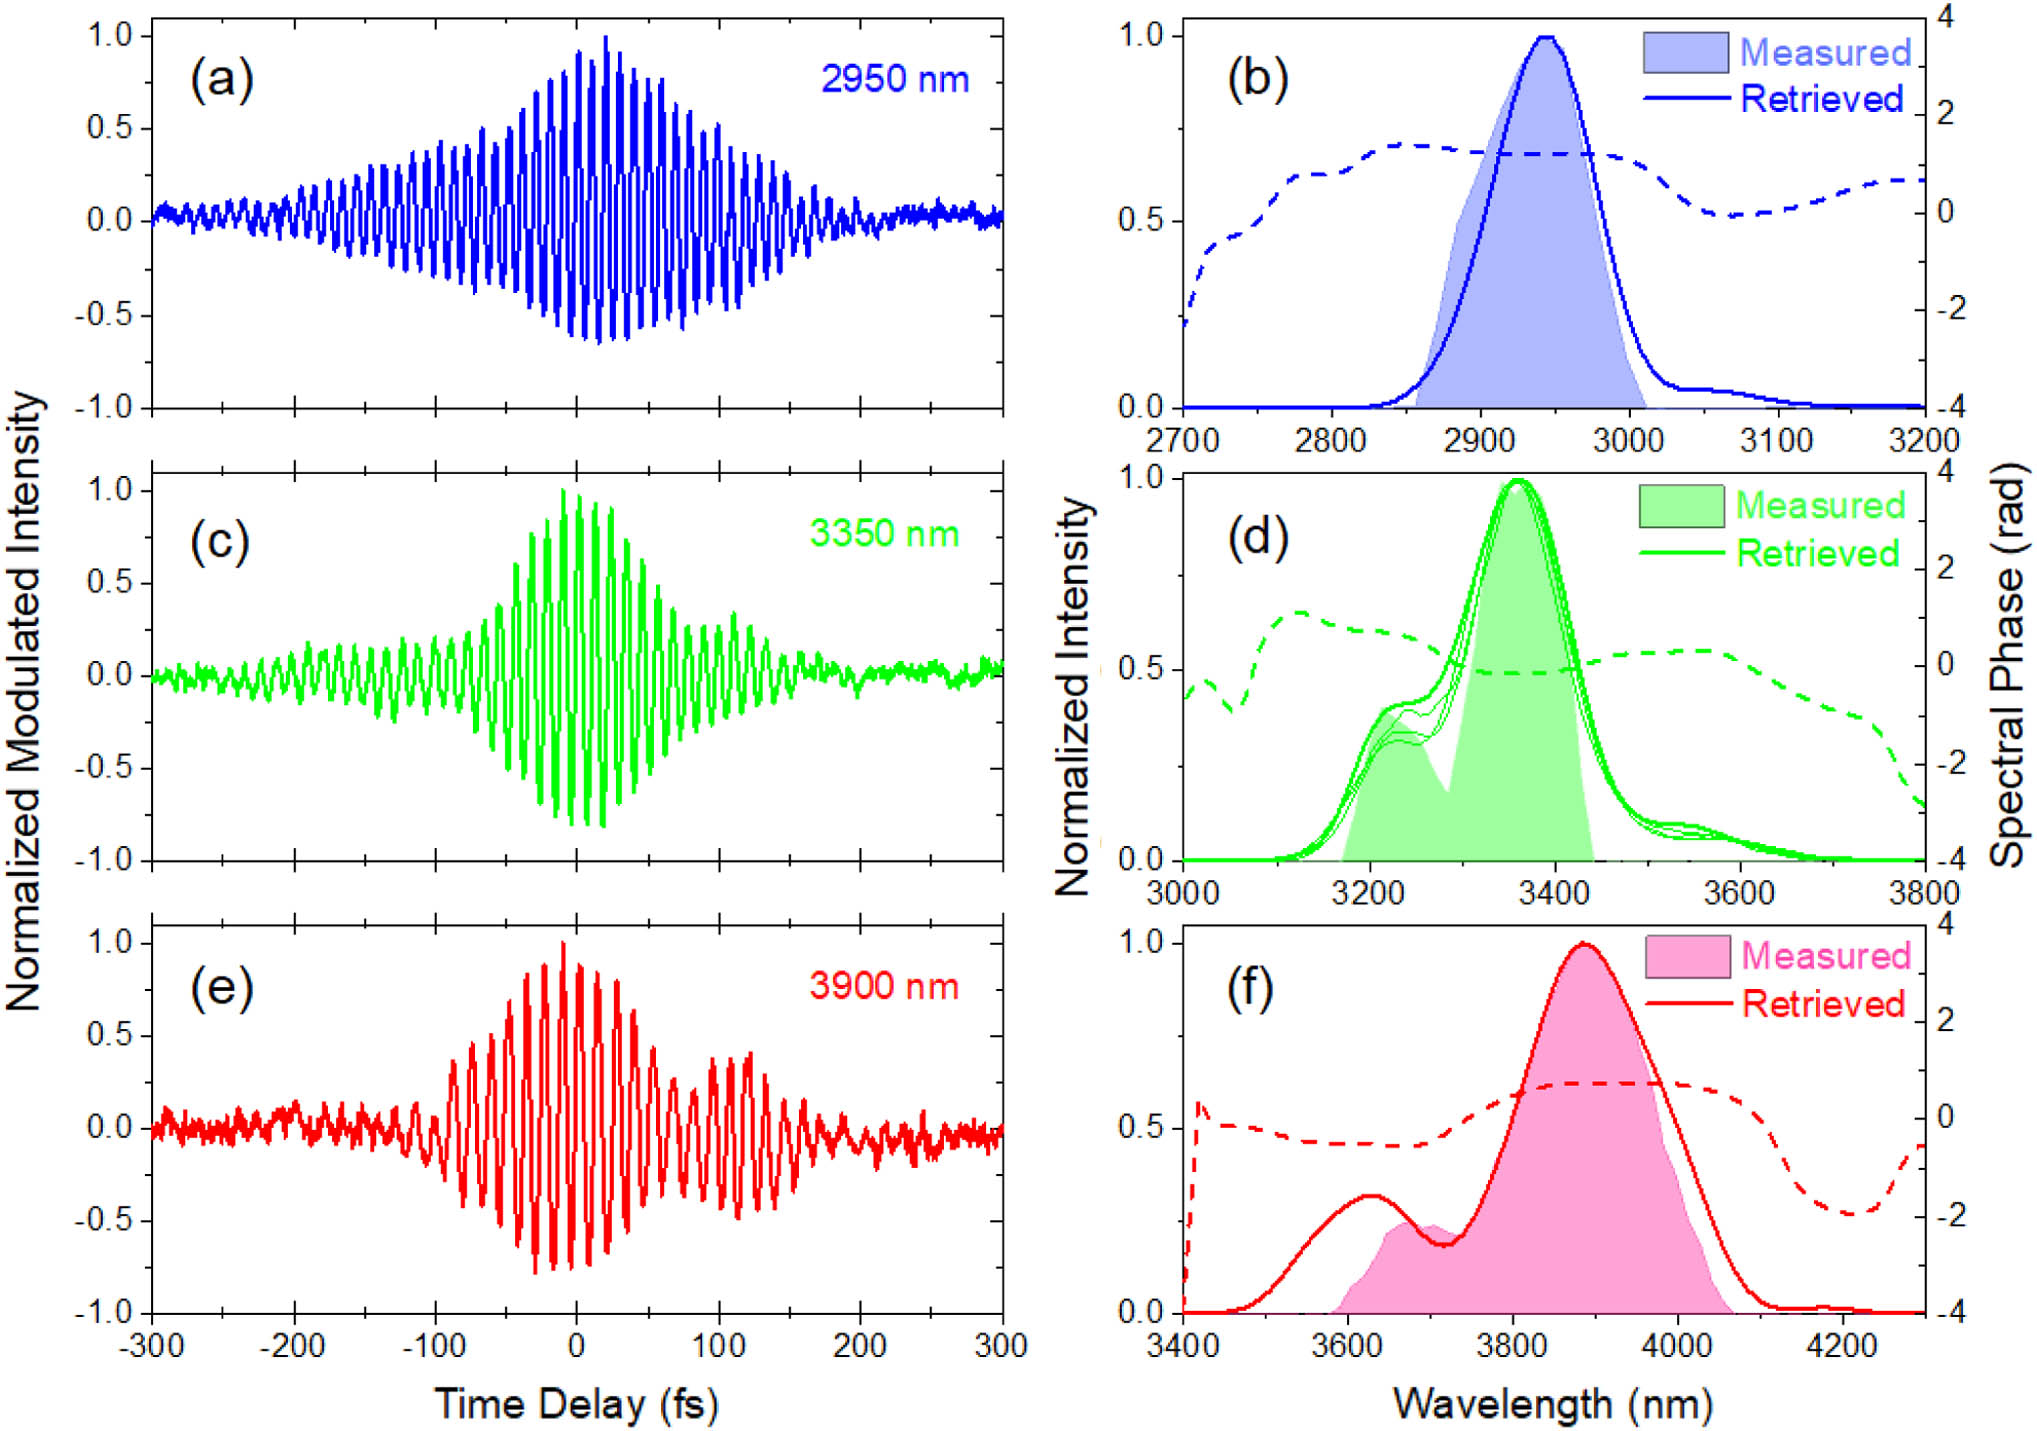
    Fig. 2. Mid-infrared pulse characterization by solid-state TIPTOE. (a), (c), (e) Modulation of band fluorescence signal obtained with a delay step size of 0.4 fs; (b), (d), (f) measured spectrum (shaded area), retrieved spectrum (solid line), and retrieved spectral phase (dashed line). The four spectra in panel (d) were obtained from four solid-state TIPTOE scans recorded consecutively under similar experimental conditions, and show the reproducibility of the retrieved spectrum.
    Sensitivity of solid-state TIPTOE to dispersion. (a) Spectra retrieved from the TIPTOE measurements. (b) Measured (dashed line) and calculated (solid line) spectral phase change induced by the addition of 8 mm Si. (c) Measured (dashed line) and calculated (solid line) spectral phase change induced by the addition of 8 mm YAG. In both (b) and (c), the spectral phase change is calculated from comparison of TIPTOE measurements with and without additional dispersive material in the signal arm.
    Fig. 3. Sensitivity of solid-state TIPTOE to dispersion. (a) Spectra retrieved from the TIPTOE measurements. (b) Measured (dashed line) and calculated (solid line) spectral phase change induced by the addition of 8 mm Si. (c) Measured (dashed line) and calculated (solid line) spectral phase change induced by the addition of 8 mm YAG. In both (b) and (c), the spectral phase change is calculated from comparison of TIPTOE measurements with and without additional dispersive material in the signal arm.
    NIR pulse characterization by solid-state TIPTOE. (a) TIPTOE modulation signal obtained with a delay step size of 0.27 fs. (b) Measured spectrum (blue line), simulated spectrum (black line), and TIPTOE retrieved spectrum (red line) on a logarithmic scale. (c) Same as (b) but using a linear scale. The peak at 1030 nm in the measured spectrum is due to amplified spontaneous emission.
    Fig. 4. NIR pulse characterization by solid-state TIPTOE. (a) TIPTOE modulation signal obtained with a delay step size of 0.27 fs. (b) Measured spectrum (blue line), simulated spectrum (black line), and TIPTOE retrieved spectrum (red line) on a logarithmic scale. (c) Same as (b) but using a linear scale. The peak at 1030 nm in the measured spectrum is due to amplified spontaneous emission.
    Measured and calculated SHG-FROG traces. (a) FROG trace calculated using the pulse retrieved from solid-state TIPTOE. (b) Independently measured SHG-FROG trace. (c) FROG trace calculated using pulses obtained from nonlinear propagation simulations including delayed rotational nonlinearity, after subtracting a quadratic phase.
    Fig. 5. Measured and calculated SHG-FROG traces. (a) FROG trace calculated using the pulse retrieved from solid-state TIPTOE. (b) Independently measured SHG-FROG trace. (c) FROG trace calculated using pulses obtained from nonlinear propagation simulations including delayed rotational nonlinearity, after subtracting a quadratic phase.
    Spectral phase of the compressed Raman-enhanced supercontinuum. Spectral intensity (red line) and phase (blue line) obtained from (a) the solid-state TIPTOE measurement and (b) one-dimensional simulations. The vertical dotted lines correspond to the spectral minima, where discrete phase steps are observed. Panels (c) and (d) show a magnified view of the spectral phase in the long-wavelength region of the spectrum, where a linear phase has been added in order to emphasize the discrete phase steps.
    Fig. 6. Spectral phase of the compressed Raman-enhanced supercontinuum. Spectral intensity (red line) and phase (blue line) obtained from (a) the solid-state TIPTOE measurement and (b) one-dimensional simulations. The vertical dotted lines correspond to the spectral minima, where discrete phase steps are observed. Panels (c) and (d) show a magnified view of the spectral phase in the long-wavelength region of the spectrum, where a linear phase has been added in order to emphasize the discrete phase steps.
    Near-infrared pulse retrieved using solid-state TIPTOE. The time-dependent intensity retrieved from the solid-state TIPTOE measurement (red line) is similar in duration to the transform-limited pulse (blue line), despite the long tail in the leading edge of the pulse arising from the Raman-enhanced supercontinuum generation.
    Fig. 7. Near-infrared pulse retrieved using solid-state TIPTOE. The time-dependent intensity retrieved from the solid-state TIPTOE measurement (red line) is similar in duration to the transform-limited pulse (blue line), despite the long tail in the leading edge of the pulse arising from the Raman-enhanced supercontinuum generation.
    CEP influence on TIPTOE measurement of the two-cycle pulse. Panels (b) and (d), ADK model; panels (c) and (e), multiphoton model. (a) Time-dependent intensity of the input pulse measured by FROG. (b), (c) Simulated TIPTOE modulation for different CEP values, showing the sensitivity of TIPTOE to the relative CEP difference between the fundamental and signal. (d), (e) Normalized peak excitation probability, showing insensitivity to the CEP variation.
    Fig. 8. CEP influence on TIPTOE measurement of the two-cycle pulse. Panels (b) and (d), ADK model; panels (c) and (e), multiphoton model. (a) Time-dependent intensity of the input pulse measured by FROG. (b), (c) Simulated TIPTOE modulation for different CEP values, showing the sensitivity of TIPTOE to the relative CEP difference between the fundamental and signal. (d), (e) Normalized peak excitation probability, showing insensitivity to the CEP variation.
    Yangyang Liu, Shima Gholam-Mirzaei, John E. Beetar, Jonathan Nesper, Ahmed Yousif, M. Nrisimhamurty, Michael Chini. All-optical sampling of few-cycle infrared pulses using tunneling in a solid[J]. Photonics Research, 2021, 9(6): 929
    Download Citation