
Yangyang Liu, Shima Gholam-Mirzaei, John E. Beetar, Jonathan Nesper, Ahmed Yousif, M. Nrisimhamurty, Michael Chini. All-optical sampling of few-cycle infrared pulses using tunneling in a solid[J]. Photonics Research, 2021, 9(6): 929
- Photonics Research
- Vol. 9, Issue 6, 929 (2021)
Abstract
1. INTRODUCTION
The development of novel sources of intense, ultrashort light pulses with controlled electric field waveforms has enabled studies of strong-field light–matter interactions in new physical regimes [1]. In particular, few-cycle femtosecond sources in the mid-infrared have allowed the extension of attosecond science [2], both into the soft X-ray spectral range [3] and into solid-state targets [4], and promise to provide a new means for strong-field control over quantum material properties [5]. Naturally, these applications demand accurate characterization of the time-dependent intensity profile, and in some cases the electric field waveform, of the pulse. While a multitude of characterization techniques based on perturbative nonlinear optics [6–8] or strong-field processes [9–12] have been demonstrated, challenges arise when applying these to the mid-infrared.
Recently, a characterization technique called tunneling ionization with a perturbation for the time-domain observation of an electric field (TIPTOE) was demonstrated, which is based on tunnel ionization in gases [13]. TIPTOE directly samples the electric field waveform of a weak “signal” pulse, spatially and temporally synchronized with an intense “fundamental” pulse, by measuring its influence on the ionization yield in air or other suitable gas targets. The measurement is performed by collecting either the ion current or the plasma fluorescence intensity as a function of the time delay between the two pulses [13,14]. Since TIPTOE relies on field ionization, it is a completely phase-matching-free technique, and the same signal can be used to characterize pulses with different central wavelengths, ranging from the ultraviolet to the mid-infrared [15], and to characterize extremely broad bandwidths. Furthermore, when implemented using laser pulses with stable carrier-envelope phase (CEP), TIPTOE is sensitive to the electric field waveform of the signal pulse, and is thus capable of measuring the absolute CEP and Gouy phase, as well as pulses with complex polarization states [14]. While these benefits suggest wide applicability of TIPTOE, the intensity required to tunnel ionize air is quite high, typically around in the near- to mid-infrared. This high intensity limits the applicability of TIPTOE technique to sources with relatively high pulse energies.
Here, we show that tunneling and multiphoton excitation in a dielectric solid can also act as an ultrafast temporal gate for pulse characterization and can likewise allow the direct measurement of electric field waveforms. The measurement is facilitated by all-optical detection of the visible band fluorescence emission from a crystal surface. In comparison to techniques based on perturbative nonlinear optics, the measurement is not limited by phase matching, does not require a reconstruction algorithm, and allows complete characterization of mid-infrared waveforms using inexpensive Si-based photodetectors. Moreover, adapting the TIPTOE technique to solids (hereafter denoted “solid-state TIPTOE”) significantly lowers the required intensity of strong-field techniques, while offering the potential for single-shot and “on-chip” detection schemes. For ZnO with a bandgap energy of 3.2 eV, the required intensity is less than . We demonstrate the effectiveness of the solid-state TIPTOE technique by characterizing microjoule-level, multicycle mid-infrared (covering ∼2.9 to 4.0 μm central wavelengths) pulses from an optical parametric amplifier, for which the excitation is in the tunneling regime, as well as few-cycle pulses (centered near 1.1 μm) compressed from Raman-enhanced supercontinuum generation in a -filled hollow capillary fiber [16,17], for which multiphoton excitation is expected to be dominant. The reliability of solid-state TIPTOE is established both by characterizing the dispersion of Si and YAG windows in the mid-infrared and by revealing the dynamics associated with the delayed rotational nonlinearity in , and is supported by numerical simulations in both the tunneling and multiphoton regimes.
Sign up for Photonics Research TOC. Get the latest issue of Photonics Research delivered right to you!Sign up now
2. EXPERIMENTAL SETUP
The solid-state TIPTOE technique is based on tunnel or multiphoton excitation of valence band electrons into the conduction band of a dielectric solid, induced by moderately intense fundamental pulses with central frequency well below the bandgap energy, as illustrated in Fig. 1(a). The excitation fraction is perturbed by a weak signal pulse and measured as a function of the time delay between the fundamental and signal. Here, we monitor the relative changes in the excitation fraction by detecting the intensity of band fluorescence emission, corresponding to relaxation of conduction band carriers excited by the laser field back to the valence band on sub-nanosecond time scales [18,19]. As the band fluorescence consists of a narrow spectral peak and is emitted into a solid angle, it provides an easy-to-detect and nonintrusive signal used to monitor the excitation fraction.
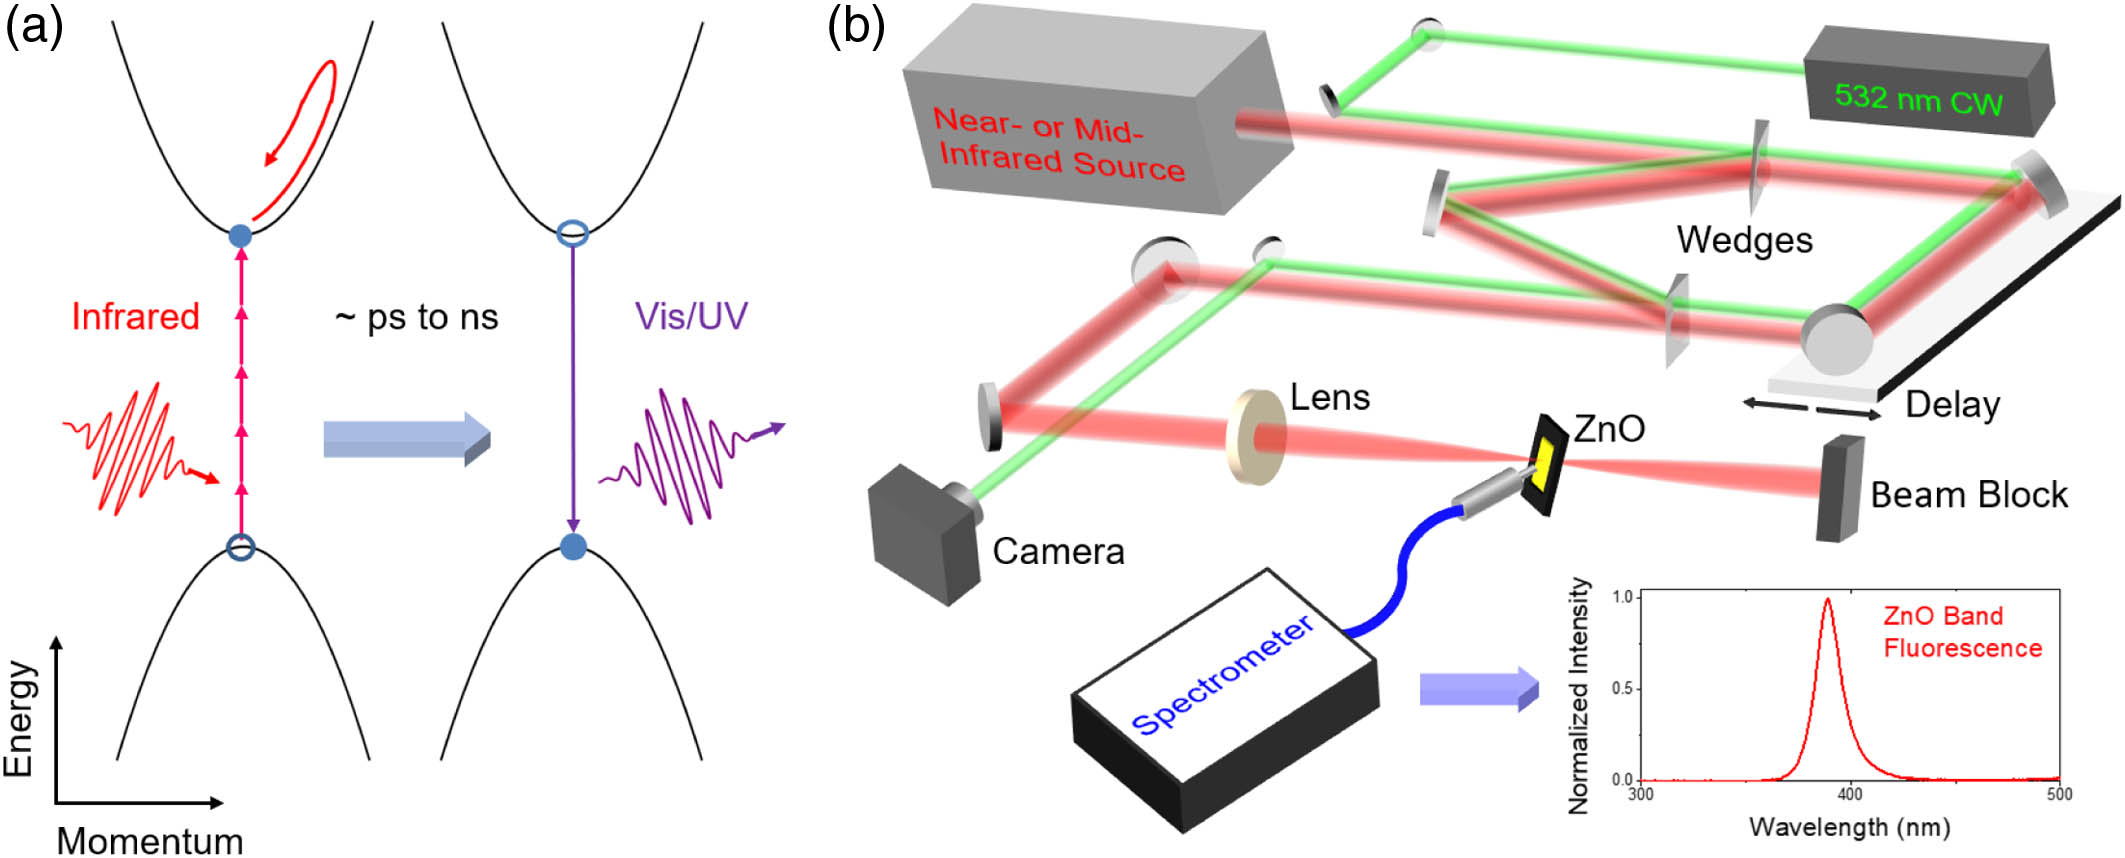
Figure 1.(a) Mechanism of solid-state TIPTOE, in which electrons are excited by multiphoton absorption or field-induced tunneling (not shown) from the valence band to the conduction band, followed by relaxation on picosecond to nanosecond time scales and band fluorescence emission. (b) Schematic of the experimental setup for solid-state TIPTOE. The inset shows a typical band fluorescence spectrum.
We apply the solid-state TIPTOE technique to characterize two different sources, operating in the mid- and near-infrared, respectively. First, microjoule-level mid-infrared pulses are produced using a two-stage optical parametric amplifier (OPA, Light Conversion ORPHEUS-ONE). The OPA is pumped by a moderately high-power Yb:KGW amplifier (Light Conversion CARBIDE), which emits 0.4 mJ, 250 fs pulses centered at 1025 nm. During the solid-state TIPTOE experiments, the laser repetition rate was set to 10 kHz. The OPA idler output is tunable from 2.2 to 4.5 μm, providing pulse durations below 100 fs and pulse energies of ∼10 μJ. For the measurements presented here, OPA idler wavelengths of 2.95, 3.35, and 3.9 μm were chosen. In addition, two-cycle near-infrared pulses are generated by nonlinear propagation of 280 fs driving pulses with 1.03 μm central wavelength from an Yb:KGW amplifier (Light Conversion PHAROS) in a -filled hollow-core capillary fiber (few-cycle Inc.) to broaden the spectrum, followed by chirped mirrors (Ultrafast Innovations PC1632) and bulk and NaCl windows for dispersion compensation. In all cases, the carrier-envelope phase of the driving laser pulses was not actively stabilized. While this fact prevents us from characterizing the electric field waveform, which varies from shot to shot, the technique retains sensitivity to the electric field envelope [15]. The CEP influence on the TIPTOE measurements and the capability of solid-state TIPTOE to characterize the waveform of pulses with stable CEP will be discussed in more detail below.
The solid-state TIPTOE measurements were performed using a pump–probe setup, as shown schematically in Fig. 1(b). In TIPTOE, the intensity of the fundamental pulse should be approximately times larger than that of the signal pulse. To meet this requirement, the signal pulse was split from the fundamental using uncoated wedged windows. The incidence angle of the wedges was 15°, and the transmitted and reflected beams after the two wedges contained approximately 85% and 0.1% of the incident energy, respectively. An equal amount of glass was placed in the reflected signal path in order to balance the dispersion. For characterizing mid-infrared pulses, 5-mm-thick wedges, with a wedge angle of 0.5°, were used as the beam splitting elements, while for near-infrared pulses, fused silica wedges with a minimum thickness of 0.2 mm and a wedge angle of 2.8° were used. We note that this two-wedge geometry will induce a small spatial chirp in the fundamental arm. However, under our experimental conditions, this was found to have a negligible effect on the spatiotemporal profile of the pump pulse. After the wedges, the spatially overlapped fundamental and signal beams were directed and focused by a lens onto the front surface of a 0.3-mm-thick -cut ZnO crystal, and the generated band fluorescence was collected at oblique incidence by a fiber-coupled spectrometer (Ocean Optics HR 2000+). The intensity in the ZnO was optimized for each source, by choosing the lens focal length ( for 2.95 and 3.35 μm, for 3.9 μm, and for the broadband near-infrared pulses) and using a variable aperture, to be approximately . The time delay between the fundamental and signal pulses was controlled by a piezoelectric stage installed in the fundamental arm and calibrated using the interference signal from a 532 nm pilot laser which propagated in both the fundamental and signal arms.
3. SOLID-STATE TIPTOE MEASUREMENTS
A. Mid-Infrared Pulse Characterization
To demonstrate the solid-state TIPTOE technique, we first characterized mid-IR pulses with central wavelengths of 2.95, 3.35, and 3.9 μm. In this case, the photon energy is far below the ZnO bandgap, and the Keldysh parameter is below unity [20]. Thus, the excitation of conduction band electrons is expected to proceed primarily through tunneling. Figures 2(a), 2(c), and 2(e) display the normalized modulation of the band fluorescence signal at each of the three wavelengths. While the TIPTOE technique is in principle capable of obtaining the electric field waveform from this modulation when the fundamental CEP is locked to zero, the CEP was not stabilized in these measurements and therefore the modulation is not sensitive to the absolute CEP of the signal pulse. Instead, the measurement reflects the electric field envelope and the time-varying frequency of the signal pulse, provided that the fundamental pulse is nearly chirp-free [15], and therefore the spectrum and spectral phase of the signal pulse can be directly obtained from the Fourier transform of the modulated signals. In Figs. 2(b), 2(d), and 2(f), the spectrum (solid line) and phase (dashed line) retrieved from each of the solid-state TIPTOE measurements are plotted together with an independently measured spectrum (shaded area) obtained using a PbSe detector-based spectrometer (Spectral Products SM301-EX). The good agreement between the measured and retrieved spectrum suggests that the solid-state TIPTOE technique is reliable for characterizing mid-infrared pulses.
![]()
Figure 2.Mid-infrared pulse characterization by solid-state TIPTOE. (a), (c), (e) Modulation of band fluorescence signal obtained with a delay step size of 0.4 fs; (b), (d), (f) measured spectrum (shaded area), retrieved spectrum (solid line), and retrieved spectral phase (dashed line). The four spectra in panel (d) were obtained from four solid-state TIPTOE scans recorded consecutively under similar experimental conditions, and show the reproducibility of the retrieved spectrum.
To further establish the reliability of solid-state TIPTOE for mid-infrared pulse characterization, we next show that the measurement is sensitive to the addition of both positive and negative dispersion to the signal pulse, as illustrated in Fig. 3. This was done by performing additional measurements in which Si or YAG windows (total thickness = 8 mm) were added in the signal arm, and comparing the spectral phases retrieved with and without the additional dispersion. We chose Si and YAG for these measurements as they exhibit normal and anomalous dispersion, respectively, for the mid-infrared wavelengths. The results of the measurements are summarized in Fig. 3. The retrieved spectra are displayed in Fig. 3(a), while the measured phase (dashed line) and calculated spectral phase (solid line) added by the Si and YAG windows are displayed, respectively, in Figs. 3(b) and 3(c). We find that the measured phase agrees well with that predicted by the Sellmeier equation [21–23]. We note that the retrieved spectra in Fig. 3 are slightly different from those in Fig. 2. This is due to day-to-day variations in the OPA spectrum, and not instability in the interferometric measurement.
![]()
Figure 3.Sensitivity of solid-state TIPTOE to dispersion. (a) Spectra retrieved from the TIPTOE measurements. (b) Measured (dashed line) and calculated (solid line) spectral phase change induced by the addition of 8 mm Si. (c) Measured (dashed line) and calculated (solid line) spectral phase change induced by the addition of 8 mm YAG. In both (b) and (c), the spectral phase change is calculated from comparison of TIPTOE measurements with and without additional dispersive material in the signal arm.
B. Near-Infrared Pulse Characterization
Next, we investigate the potential of the solid-state TIPTOE technique for characterizing shorter-wavelength, few-cycle pulses in the near-infrared. In this case, the Keldysh parameter is calculated to be 1.1, and three-photon excitation is expected to be the dominant mechanism for exciting carriers. In the experiments, driving laser pulses (0.4 mJ, 280 fs) centered at 1025 nm were used to generate a supercontinuum spectrum, covering 800–1400 nm, after nonlinear propagation in a -filled hollow-core capillary fiber. After collimating, the spectrally broadened pulses were compressed using chirped mirrors and glass to a duration of 6.9 fs, corresponding to 1.8 cycles at the shifted central wavelength of 1148 nm. The compressed pulses were characterized using both a home-built single-shot frequency-resolved optical gating (FROG) device, using second-harmonic generation (SHG) in a 10-μm-thick BBO crystal as the nonlinear signal, and the ZnO-based solid-state TIPTOE setup.
The normalized modulation of the band fluorescence signal is shown in Fig. 4(a). The delay dependence of the modulation signal reflects the unusual temporal structure of the pulses compressed using the molecular gas. Close to zero time delay, the most intense portion of the pulse consists of only two cycles of the electric field [inset of Fig. 4(a)]. However, for negative time delays, a weak tail persists for approximately 600 fs, which results from the delayed nature of the rotational Raman nonlinearity.
![]()
Figure 4.NIR pulse characterization by solid-state TIPTOE. (a) TIPTOE modulation signal obtained with a delay step size of 0.27 fs. (b) Measured spectrum (blue line), simulated spectrum (black line), and TIPTOE retrieved spectrum (red line) on a logarithmic scale. (c) Same as (b) but using a linear scale. The peak at 1030 nm in the measured spectrum is due to amplified spontaneous emission.
The spectral intensity, obtained from the Fourier transform of the modulation signal, is shown in Fig. 4(b). By comparing the spectrum retrieved from the solid-state TIPTOE (red line) with the independently measured spectrum (blue line, obtained using Ocean Optics HR2000+ and Ocean Optics FLAME-NIR spectrometers), we find that there are two significant differences. First, we observe strong modulations in the long-wavelength side of the retrieved spectrum, while the measured spectrum is comparatively flat. This discrepancy stems largely from the limited resolution of the InGaAs spectrometer used to measure the long-wavelength side of the spectrum, and the strong modulation on the long-wavelength side of the spectrum is in good agreement with simulations of the Raman-enhanced spectral broadening in (Figs. 5 and 6). Additionally, for the short-wavelength components between 800 and 960 nm, the retrieved spectrum is substantially weaker than the measured spectrum. To understand this, we simulated the TIPTOE signal using the multiphoton model of excitation [24], with a multiphoton parameter and multiphoton excitation cross section [25]. The simulations were performed using the independently measured spectrum and a flat spectral phase for both the fundamental and signal pulses, calculating the excitation probability as a function of the time delay and performing the Fourier transform in order to obtain the spectrum. The spectrum retrieved from the simulated TIPTOE data is shown as the black line in Fig. 4(b). We find that the short-wavelength component of the simulated spectrum is weaker than in the measured spectrum, in good agreement with the spectrum retrieved from the solid-state TIPTOE measurements. Additional simulations conducted under different conditions and using the ADK (Ammosov-Delone-Krainov) [26] and Yudin-Ivanov [27] formalisms to model the excitation process, suggest that the underestimation of the short-wavelength components stems from the multiphoton excitation mechanism, which fails to adequately sample the highest-frequency oscillations of the electric field. We further note that the spectrum reconstructed from TIPTOE depends on the time window of the measurement, and therefore can differ from a spectrum measured by a grating spectrometer.
We further validate the solid-state TIPTOE measurement by comparing it to an independent measurement of the near-infrared pulses using FROG, as shown in Fig. 5. To do this, we have numerically simulated the SHG FROG spectrogram corresponding to the pulse retrieved from solid-state TIPTOE [Fig. 5(a)] and compared it to the spectrogram measured using our SHG FROG device [Fig. 5(b)]. The spectral broadening in results in a characteristic “Raman chirp” [17] which is evident in the long-wavelength side of the FROG spectrogram, even after compression using chirped mirrors. This behavior is in good agreement with one-dimensional nonlinear propagation simulations, in which the time-dependent nonlinear phase is modeled using a density matrix model, as shown in Fig. 5(c). In the simulations, a constant value of group delay dispersion (GDD) was subtracted from the spectral phase after propagation to model the effects of chirped mirror compression. As is evident in the figure, the three FROG traces are qualitatively similar. Specifically, each of the three traces shows a strong, narrow peak near zero delay covering the short-wavelength portions of the spectrogram, while the long wavelengths exhibit a broad, curved feature associated with the Raman chirp (Fig. 6).
![]()
Figure 5.Measured and calculated SHG-FROG traces. (a) FROG trace calculated using the pulse retrieved from solid-state TIPTOE. (b) Independently measured SHG-FROG trace. (c) FROG trace calculated using pulses obtained from nonlinear propagation simulations including delayed rotational nonlinearity, after subtracting a quadratic phase.
![]()
Figure 6.Spectral phase of the compressed Raman-enhanced supercontinuum. Spectral intensity (red line) and phase (blue line) obtained from (a) the solid-state TIPTOE measurement and (b) one-dimensional simulations. The vertical dotted lines correspond to the spectral minima, where discrete phase steps are observed. Panels (c) and (d) show a magnified view of the spectral phase in the long-wavelength region of the spectrum, where a linear phase has been added in order to emphasize the discrete phase steps.
The measurements of few-cycle pulses compressed from the Raman-enhanced supercontinuum reveal several interesting properties, such as the long tail in the leading edge of the pulse, the strong modulation in the long-wavelength side of the spectrum, and the curved feature in the FROG spectrogram. It is interesting to investigate underlying physics behind the Raman-enhanced supercontinuum, and it also provides a useful test of whether solid-state TIPTOE can characterize complex pulses. In Fig. 6, we compare the TIPTOE measurement with simulations of spectral broadening based on a one-dimensional density matrix model [16]. As is the case in Fig. 5, a constant GDD is subtracted from the simulations in order to model the effects of the chirped mirror compressor. The spectral intensity and phase retrieved from the TIPTOE measurements and simulations are displayed in Figs. 6(a) and 6(b), respectively. We find that the spectral phase between ∼890 and 1025 nm is nearly constant, which agrees well with FROG measurements. Below 890 nm, the phase retrieved from the experiments becomes unreliable due to the low signal level and zeroes in the retrieved spectrum. Beyond 1025 nm, however, we observe strong oscillations in the spectrum, and the phase increases from 0 to ∼120 rad. This occurs due to discrete steps in the phase occurring at spectral amplitude minima. Between spectral amplitude minima, the spectral phase variation is approximately linear, which is a hallmark of self-phase modulation. To clearly show this behavior, the group delay and the constant phase offset are adjusted to better show the phase variation in the long-wavelength side of the spectrum, and the phases are re-plotted in Figs. 6(c) and 6(d). The spectral phase retrieved from the solid-state TIPTOE measurement, including both the magnitudes of the discrete steps and the intervals of linear phase, is quantitatively similar to the one-dimensional simulation. The results showcase the ability of the solid-state TIPTOE technique to characterize complex pulses.
The intensity profile of the near-infrared pulse obtained using solid-state TIPTOE is compared with the corresponding Fourier-transform-limited pulse in Fig. 7. The peak of the pulse obtained from TIPTOE has been moved to time zero for comparison with the transform-limited pulse, by subtracting a linear phase from the phase presented in Fig. 6. As shown in the inset, the retrieved pulse duration of 7.9 fs is nearly identical to the transform-limited pulse duration. This suggests that the discrete phase steps shown in Fig. 6 do not significantly impact the formation of the shortest pulse. However, the complex phase associated with the Raman-enhanced supercontinuum does result in the long tail on the leading edge of the pulse, which reduces the peak intensity in comparison to the transform-limited pulse. The peak intensity of the measured pulse is calculated to be 45% that of the transform-limited pulse. We note that the pulse duration obtained from the TIPTOE measurement (7.9 fs) is slightly longer than the pulse duration measured with FROG (6.9 fs). This discrepancy results from the inability of the solid-state TIPTOE to resolve the shortest-wavelength components of the spectrum when the excitation occurs in the multiphoton regime, as discussed in the main text and shown in Fig. 4.
![]()
Figure 7.Near-infrared pulse retrieved using solid-state TIPTOE. The time-dependent intensity retrieved from the solid-state TIPTOE measurement (red line) is similar in duration to the transform-limited pulse (blue line), despite the long tail in the leading edge of the pulse arising from the Raman-enhanced supercontinuum generation.
4. CEP INFLUENCE ON CHARACTERIZING A TWO-CYCLE PULSE USING TIPTOE
While the gas-phase TIPTOE technique is known to be sensitive to the absolute carrier-envelope phase when using few-cycle pulses, our solid-state TIPTOE measurements were performed without CEP stabilization. Previously, it has been shown that TIPTOE can effectively retrieve the pulse envelope for multicycle pulses, and that for few-cycle pulses the oscillation phase is determined by the difference in CEP between the fundamental and signal arms. However, the effects of CEP on the TIPTOE retrieval of few-cycle pulses have not been established.
The electric fields of the fundamental and signal pulses can be expressed as and , respectively, where and are the envelopes of the respective waveforms, and and are their absolute carrier-envelope phases. In our case, the CEP is unlocked and thus we can assume that the CEPs both contain a constant term, associated with propagation through their respective optical paths, and a time-dependent variation associated with the unstable laser CEP. Then, and can be expressed as and , where and denote the constant and time-varying terms, respectively. Since the fundamental and signal pulses are derived from the same laser source, and are expected to vary identically. Therefore, the modulated excitation probability can be expressed, using lowest-order perturbation theory, as [14]. This means that even if the CEP is not locked, the measured modulation has a constant oscillation phase which is related to the relative CEP difference between the fundamental and signal fields. Because the variation of the absolute CEP value does not affect the pulse envelope, the TIPTOE signal accurately encodes the pulse envelope, and thus the spectrum and spectral phase, even without CEP stabilization. To confirm this, we have simulated the TIPTOE signal corresponding to the 6.9 fs pulses retrieved from the experimental FROG trace in Fig. 5(b), with varying signal and fundamental CEP. The intensity envelope of the near-infrared pulse is displayed in Fig. 8(a). The TIPTOE simulations were performed using both the ADK model, to simulate tunneling excitation, and the multiphoton model with the same multiphoton parameter and cross section as in Fig. 4, and are displayed in the left and right panels of Fig. 8, respectively. The retrieved pulses are consistent with the envelope of the input pulse (black line) regardless of the CEP values used, while the modulation phase depends only on the relative CEP difference . For pulses with the same relative CEP, as indicated by the red line and the dotted blue line in Figs. 8(b) and 8(c), the retrieved oscillations are identical. However, if the relative CEP changes, as is the case for the gray line, the modulation will also change. The simulations thus agree well with the analytical theory based on perturbation theory.
![]()
Figure 8.CEP influence on TIPTOE measurement of the two-cycle pulse. Panels (b) and (d), ADK model; panels (c) and (e), multiphoton model. (a) Time-dependent intensity of the input pulse measured by FROG. (b), (c) Simulated TIPTOE modulation for different CEP values, showing the sensitivity of TIPTOE to the relative CEP difference between the fundamental and signal. (d), (e) Normalized peak excitation probability, showing insensitivity to the CEP variation.
While the discussion above confirms that the CEP variation of the laser source does not impact the oscillation phase of the TIPTOE signal, the CEP variation can also induce fluctuations in the excitation probability. These variations can lead to instability in the TIPTOE signal, and therefore must also be considered. We therefore simulate the TIPTOE process with different CEPs, again using both the ADK and multiphoton models. We assume that the CEP difference between the fundamental and signal pulses is fixed and vary the absolute CEP of both pulses from 0 to . The peak of the modulated ionization probability is plotted for varying CEP in Figs. 8(d) and 8(e). We find that the fluctuation of the modulation peak is approximately 0.5% and 0.3% for the ADK and multiphoton models, respectively. This is considerably smaller than the observed fluctuations in the experimental TIPTOE signal, which likely arise from source and path length instabilities. We conclude that the measured TIPTOE modulation is affected only by the relative CEP difference between the fundamental and signal pulses, and therefore that TIPTOE can directly characterize a two-cycle pulse without CEP stabilization.
5. CONCLUSIONS
In conclusion, we have demonstrated that multiphoton and tunneling excitation in a solid can provide an ultrafast temporal gate for pulse characterization, and therefore that the TIPTOE technique, previously established for ionization in gases, can be applied in dielectric solids. The solid-state TIPTOE technique significantly lowers the required intensity in comparison to gases, and allows phase matching-free measurements of pulses spanning the near- to mid-infrared using detectors sensitive to visible light. We have established the reliability of solid-state TIPTOE by characterizing microjoule-level mid-infrared pulses from an OPA and few-cycle near-infrared pulses compressed from redshifted supercontinuum generated from a -filled hollow-core capillary fiber. By stabilizing the CEP of the driving laser pulses, full characterization of the electric field waveform, including the absolute phase, can be achieved. While the measurements presented here rely upon spectrally resolving the band fluorescence from ZnO crystals, the solid-state TIPTOE technique can be applied using other crystals and detection geometries to extend the range of applications. For example, crystals with larger bandgap energies and higher damage thresholds can be chosen to extend the detection range to shorter wavelengths, while detection using multiphoton photoconductivity in a photodiode or charge-coupled device can be used to simplify the detection scheme. Importantly, the use of image or active pixel sensors, such as CCD or CMOS detectors, for the detection of the TIPTOE signal has the potential to enable single-shot detection of optical waveforms [28].
Acknowledgment
Acknowledgment. We would like to thank Zenghu Chang for loaning the PbSe spectrometer used to measure the mid-infrared spectra. S. G. was supported by the NSF. M. N. was supported by the DOE, Office of Science, Basic Energy Sciences (BES).
References
[1] T. Brabec, F. Krausz. Intense few-cycle laser fields: frontiers of nonlinear optics. Rev. Mod. Phys., 72, 545-591(2000).
[2] F. Krausz, M. Y. Ivanov. Attosecond physics. Rev. Mod. Phys., 81, 163-234(2009).
[3] T. Popmintchev, M.-C. Chen, D. Popmintchev, P. Arpin, S. Brown, S. Ališauskas, G. Andriukaitis, T. Balčiunas, O. D. Mücke, A. Pugzlys, A. Baltuška, B. Shim, S. E. Schrauth, A. Gaeta, C. Hernández-García, L. Plaja, A. Becker, A. Jaron-Becker, M. M. Murnane, H. C. Kapteyn. Bright coherent ultrahigh harmonics in the keV X-ray regime from mid-infrared femtosecond lasers. Science, 336, 1287-1291(2012).
[4] S. Ghimire, A. D. DiChiara, E. Sistrunk, P. Agostini, L. F. DiMauro, D. A. Reis. Observation of high-order harmonic generation in a bulk crystal. Nat. Phys., 7, 138-141(2011).
[5] Y. H. Wang, H. Steinberg, P. Jarillo-Herrero, N. Gedik. Observation of Floquet-Bloch states on the surface of a topological insulator. Science, 342, 453-457(2013).
[6] R. Trebino, K. W. DeLong, D. N. Fittinghoff, J. N. Sweetser, M. A. Krumbügel, B. A. Richman, D. J. Kane. Measuring ultrashort laser pulses in the time-frequency domain using frequency-resolved optical gating. Rev. Sci. Instrum., 68, 3277-3295(1997).
[7] Y. Nomura, H. Shirai, T. Fuji. Frequency-resolved optical gating capable of carrier-envelope phase determination. Nat. Commun., 4, 2820(2013).
[8] M. Miranda, C. L. Arnold, T. Fordell, F. Silva, B. Alonso, R. Weigand, A. L’Huillier, H. Crespo. Characterization of broadband few-cycle laser pulses with the d-scan technique. Opt. Express, 20, 18732-18743(2012).
[9] E. Goulielmakis, M. Uiberacker, R. Kienberger, A. Baltuska, V. Yakovlev, A. Scrinzi, T. Westerwalbesloh, U. Kleineberg, U. Heinzmann, M. Drescher, F. Krausz. Direct measurement of light waves. Science, 305, 1267-1269(2004).
[10] K. T. Kim, C. Zhang, A. D. Shiner, B. E. Schmidt, F. Légaré, D. M. Villeneuve, P. B. Corkum. Petahertz optical oscilloscope. Nat. Photonics, 7, 958-962(2013).
[11] A. S. Wyatt, T. Witting, A. Schiavi, D. Fabris, P. Matia-Hernando, I. A. Walmsley, J. P. Marangos, J. W. G. Tisch. Attosecond sampling of arbitrary optical waveforms. Optica, 3, 303-310(2016).
[12] A. Korobenko, K. Johnston, M. Kubullek, L. Arissian, Z. Dube, T. Wang, M. Kübel, A. Y. Naumov, D. M. Villeneuve, M. F. Kling, P. B. Corkum, A. Staudte, B. Bergues. Femtosecond streaking of ambient air. Optica, 7, 1372-1376(2020).
[13] S. B. Park, K. Kim, W. Cho, S. I. Hwang, I. Ivanov, C. H. Nam, K. T. Kim. Direct sampling of a light wave in air. Optica, 5, 402-408(2018).
[14] N. Saito, N. Ishii, T. Kanai, J. Itatani. All-optical characterization of the two-dimensional waveform and the Gouy phase of an infrared pulse based on plasma fluorescence of gas. Opt. Express, 26, 24591-24601(2018).
[15] W. Cho, S. I. Hwang, C. H. Nam, M. R. Bionta, P. Lassonde, B. E. Schmidt, H. Ibrahim, F. Légaré, K. T. Kim. Temporal characterization of femtosecond laser pulses using tunneling ionization in the UV, visible, and mid-IR ranges. Sci. Rep., 9, 16067(2019).
[16] J. E. Beetar, M. Nrisimhamurty, T.-C. Truong, G. C. Nagar, Y. Liu, J. Nesper, O. Suarez, F. Rivas, Y. Wu, B. Shim, M. Chini. Multioctave supercontinuum generation and frequency conversion based on rotational nonlinearity. Sci. Adv., 6, eabb5375(2020).
[17] P. A. Carpeggiani, G. Coccia, G. Fan, E. Kaksis, A. Pugžlys, A. Baltuška, R. Piccoli, Y.-G. Jeong, A. Rovere, R. Morandotti, L. Razzari, B. E. Schmidt, A. A. Voronin, A. M. Zheltikov. Extreme Raman red shift: ultrafast multimode nonlinear space-time dynamics, pulse compression, and broadly tunable frequency conversion. Optica, 7, 1349-1354(2020).
[18] V. A. Fonoberov, K. A. Alim, A. A. Balandin, F. Xiu, J. Liu. Photoluminescence investigation of the carrier recombination processes in ZnO quantum dots and nanocrystals. Phys. Rev. B, 73, 165317(2006).
[19] P. A. Rodnyi, I. V. Khodyuk. Optical and luminescence properties of zinc oxide (Review). Opt. Spectrosc., 111, 776-785(2011).
[20] L. V. Keldysh. Ionization in the field of a strong electromagnetic wave. Sov. Phys. JETP, 20, 1307-1314(1965).
[21] C. D. Salzberg, J. J. Villa. Infrared refractive indexes of silicon, germanium and modified selenium glass. J. Opt. Soc. Am., 47, 244-246(1957).
[22] B. Tatian. Fitting refractive-index data with the Sellmeier dispersion formula. Appl. Opt., 23, 4477-4485(1984).
[23] D. E. Zelmon, D. L. Small, R. Page. Refractive-index measurements of undoped yttrium aluminum garnet from 0.4 to 5.0 μm. Appl. Opt., 37, 4933-4935(1998).
[24] Z. Chang. Fundamentals of Attosecond Optics(2011).
[25] M. G. Vivas, T. Shih, T. Voss, E. Mazur, C. R. Mendonca. Nonlinear spectra of ZnO: reverse saturable, two- and three-photon absorption. Opt. Express, 18, 9628-9633(2010).
[26] M. V. Ammosov, N. B. Delone, V. P. Krainov. Tunnel ionization of complex atoms and of atomic ions in an alternating electromagnetic field. Sov. Phys. JETP, 64, 1191-1194(1986).
[27] G. Yudin, M. Ivanov. Nonadiabatic tunnel ionization: looking inside a laser cycle. Phys. Rev. A, 64, 6-9(2001).
[28] Y. Liu, J. Nesper, M. Chini. Single-shot measurement of a laser waveform using photoconductivity in the tunneling and multiphoton regimes.

Set citation alerts for the article
Please enter your email address
© Copyright 2018-2021 | Chinese Laser Press. All Rights Reserved 沪ICP备15018463号-20