• Chinese Optics Letters
  • Vol. 20, Issue 10, 100007 (2022)
Samrit Mainali, Fabien Gatti*, and Osman Atabek
Author Affiliations
  • Institut des Sciences Moléculaires d’Orsay, CNRS, Université Paris-Saclay, 91405 Orsay, France
  • show less
    DOI: 10.3788/COL202220.100007 Cite this Article Set citation alerts
    Samrit Mainali, Fabien Gatti, Osman Atabek. Laser control strategies in full-dimensional funneling dynamics: the case of pyrazine [Invited][J]. Chinese Optics Letters, 2022, 20(10): 100007 Copy Citation Text show less
    Schematic view of the three-state model used for pyrazine. The ground state S0 is indicated in thick solid blue line. The bright donor state S2 is a thick solid black line, and the dark acceptor state S2 is a thick solid red line. The thin horizontal lines are for the corresponding vibrational states. The interstate coupling W12 in the dotted blue line and the transition dipole moments µ01 and µ02 are also indicated.
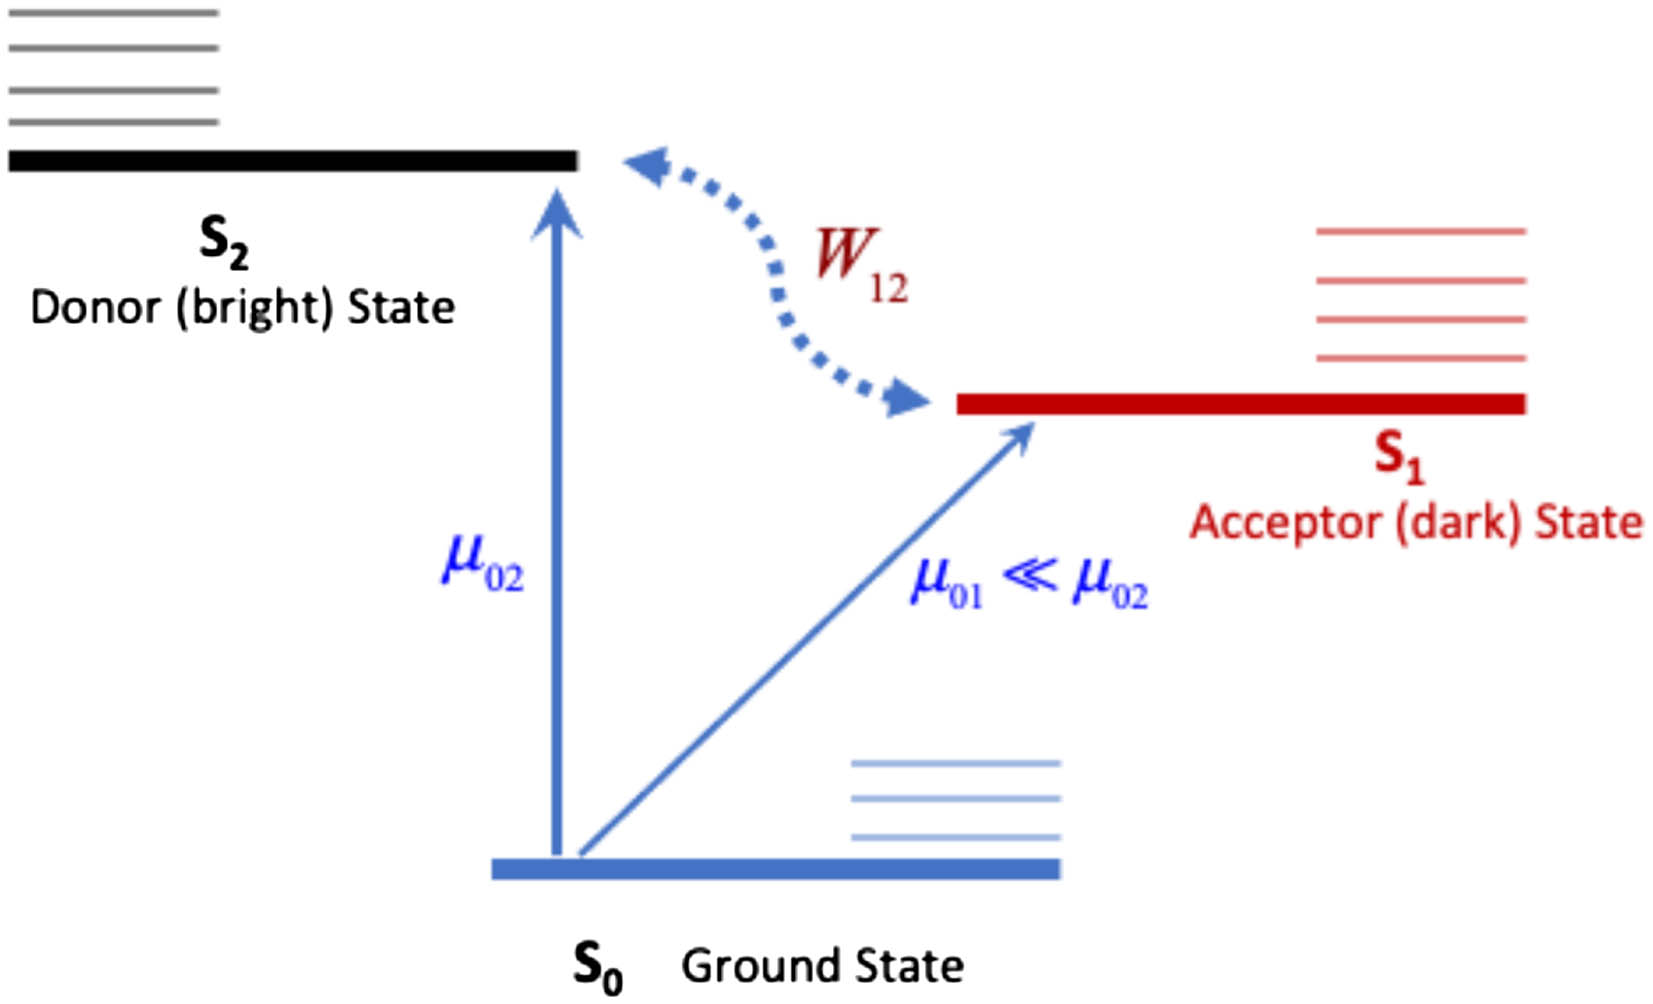
    Fig. 1. Schematic view of the three-state model used for pyrazine. The ground state S0 is indicated in thick solid blue line. The bright donor state S2 is a thick solid black line, and the dark acceptor state S2 is a thick solid red line. The thin horizontal lines are for the corresponding vibrational states. The interstate coupling W12 in the dotted blue line and the transition dipole moments µ01 and µ02 are also indicated.
    Excited states populations as a function of propagation time in a minimal 2D model involving the CI branching space. P2 and P1 are, respectively, indicated by thin black and thick red solid lines. The blue vertical arrow at t = 0 symbolizes the vertical launching of the v = 0 wavepacket from the initial state S0. T1 and T2 are, respectively, the vibrational periods of the excited states S1 and S2. W12−1 is a notation for the CI characteristic transfer time.
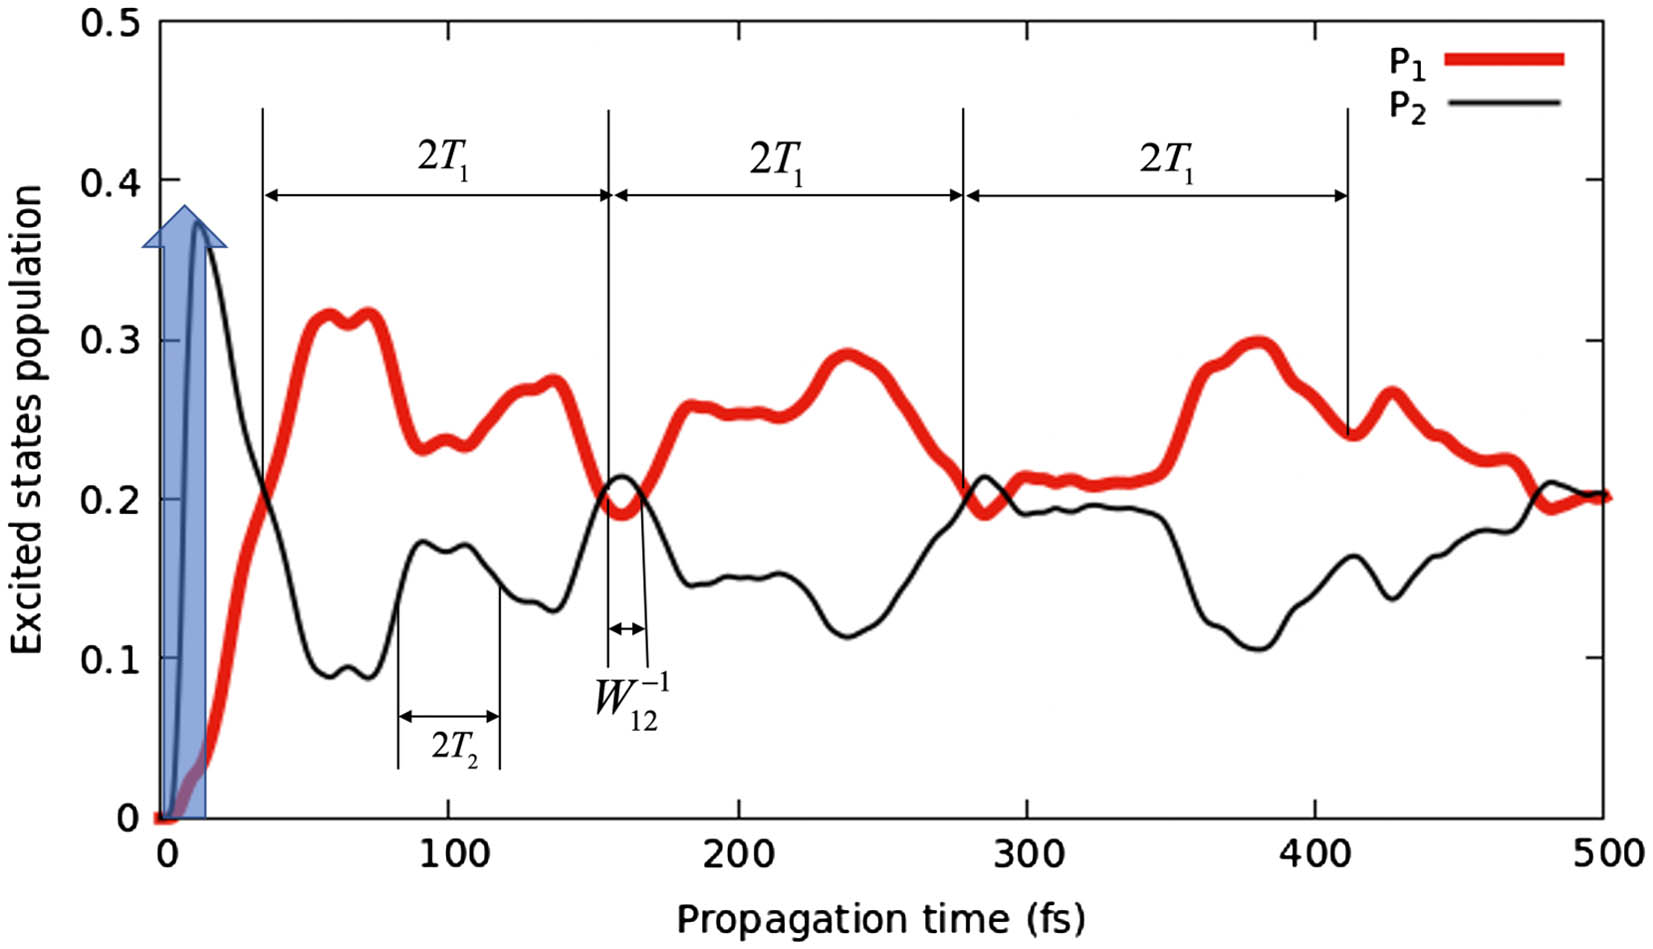
    Fig. 2. Excited states populations as a function of propagation time in a minimal 2D model involving the CI branching space. P2 and P1 are, respectively, indicated by thin black and thick red solid lines. The blue vertical arrow at t = 0 symbolizes the vertical launching of the v = 0 wavepacket from the initial state S0. T1 and T2 are, respectively, the vibrational periods of the excited states S1 and S2. W12−1 is a notation for the CI characteristic transfer time.
    Excited states populations as a function of propagation time in 4D (upper panel) and full 24D models (lower panel). Same notations as for Fig. 2.
    Fig. 3. Excited states populations as a function of propagation time in 4D (upper panel) and full 24D models (lower panel). Same notations as for Fig. 2.
    Sine-square laser electric field envelopes for two identical pulses as a function of time. The illustrated pulse duration corresponds to T = 14 fs, whereas the inter-pulse time delay is τ = 6 fs.
    Fig. 4. Sine-square laser electric field envelopes for two identical pulses as a function of time. The illustrated pulse duration corresponds to T = 14 fs, whereas the inter-pulse time delay is τ = 6 fs.
    Excited state population P2 as a function of the leading intensity. Red dashed thin line for a single pulse, black thick solid line for two equal fluence pulses, with a delay of τ = 13 fs.
    Fig. 5. Excited state population P2 as a function of the leading intensity. Red dashed thin line for a single pulse, black thick solid line for two equal fluence pulses, with a delay of τ = 13 fs.
    Asymptotic contrast (4D) as a function of the inter-pulse delay τ for two pulses, each with a duration of T = 14 fs, equal fluence pulses of leading intensity I. The weak field regime is illustrated by the intensities I = 5 × 10¹² W/cm2 in the blue dashed-dotted line, and by I = 1013 W/cm2 in the red dashed line. I = 8.8 × 10¹³ W/cm2 corresponds to the strong field regime, represented by the black solid curve.
    Fig. 6. Asymptotic contrast (4D) as a function of the inter-pulse delay τ for two pulses, each with a duration of T = 14 fs, equal fluence pulses of leading intensity I. The weak field regime is illustrated by the intensities I = 5 × 10¹² W/cm2 in the blue dashed-dotted line, and by I = 1013 W/cm2 in the red dashed line. I = 8.8 × 10¹³ W/cm2 corresponds to the strong field regime, represented by the black solid curve.
    Excited states populations as a function of the propagation time for two pulses of intensity I = 1013 W/cm2 delayed by τ = 25 fs. P0 is indicated in the dashed-dotted black line, P1 in the thick red solid line, and P2 in the thin solid black line.
    Fig. 7. Excited states populations as a function of the propagation time for two pulses of intensity I = 1013 W/cm2 delayed by τ = 25 fs. P0 is indicated in the dashed-dotted black line, P1 in the thick red solid line, and P2 in the thin solid black line.
    Excited states populations as a function of the propagation time for two pulses of intensity I = 8.8 × 10¹³ W/cm2 delayed by τ = 6 fs from a full 24D model. P0 is indicated in the dashed-dotted black line, P1 in the thick red solid line, and P2 in the thin solid black line.
    Fig. 8. Excited states populations as a function of the propagation time for two pulses of intensity I = 8.8 × 10¹³ W/cm2 delayed by τ = 6 fs from a full 24D model. P0 is indicated in the dashed-dotted black line, P1 in the thick red solid line, and P2 in the thin solid black line.
    Excited states populations as a function of the propagation time for two pulses of intensity I = 8.8 × 10¹³ W/cm2 delayed by τ = 75 fs from a full 24D model. P0 is indicated in the dashed-dotted black line, P1 in the thick red solid line, and P2 in the thin solid black line.
    Fig. 9. Excited states populations as a function of the propagation time for two pulses of intensity I = 8.8 × 10¹³ W/cm2 delayed by τ = 75 fs from a full 24D model. P0 is indicated in the dashed-dotted black line, P1 in the thick red solid line, and P2 in the thin solid black line.
    Asymptotic contrast (4D) as a function of the inter-pulse delay τ for five equal kicks at a fixed intensity I = 5 × 10¹² W/cm2. The thin black solid line is for kicks duration T = 10 fs; the thick red solid line is for T = 7 fs.
    Fig. 10. Asymptotic contrast (4D) as a function of the inter-pulse delay τ for five equal kicks at a fixed intensity I = 5 × 10¹² W/cm2. The thin black solid line is for kicks duration T = 10 fs; the thick red solid line is for T = 7 fs.
    Excited states populations as a function of the propagation time for five ultra-short T = 10 fs pulses of intensity I = 5 × 10¹² W/cm2 delayed by τ = 13 fs for a full 24D model. P0 is indicated in the dashed-dotted black line, P1 in the thick red solid line, and P2 in the thin solid black line.
    Fig. 11. Excited states populations as a function of the propagation time for five ultra-short T = 10 fs pulses of intensity I = 5 × 10¹² W/cm2 delayed by τ = 13 fs for a full 24D model. P0 is indicated in the dashed-dotted black line, P1 in the thick red solid line, and P2 in the thin solid black line.
    nQ˜1Q˜2Q˜3Q˜4Q˜5Q˜6Q˜7Q˜8
    11010444444
    22828444444
    32828444444
    Table 1. Number of Single-Particle Functions (n1n8) Used for the Eight Combined Modesa
    Mechanismω (eV)p
    Interference4.560.3
    I=8.8×10¹³W/cm24.771.6
    τ=6fs4.910.45
    T=14fs5.150.67
    Kicks4.560.58
    I=5×10¹²W/cm24.771.71
    τ=13fs4.911.64
    T=10fs5.150.61
    Table 2. Contrasts for Several Excitation Frequencies for Both Mechanisms Discussed in the Texta
    Samrit Mainali, Fabien Gatti, Osman Atabek. Laser control strategies in full-dimensional funneling dynamics: the case of pyrazine [Invited][J]. Chinese Optics Letters, 2022, 20(10): 100007
    Download Citation