Author Affiliations
1Dipartimento di Fisica, Politecnico di Milano and Istituto di Fotonica e Nanotecnologie del Consiglio Nazionale delle Ricerche, Piazza L. da Vinci 32, I-20133 Milano, Italy2Department of Electrical Engineering, The State University of New York at Buffalo, Buffalo, New York 14260, USAshow less
Fig. 1. (a) Schematic of a microring sustaining cw and ccw TWMs. Control of linear mode couplings
κ1,2 based on the use of (b) two Rayleigh scatterers (dots) [
19,
20], and (c) combined phase-shifted index and loss gratings [
21].
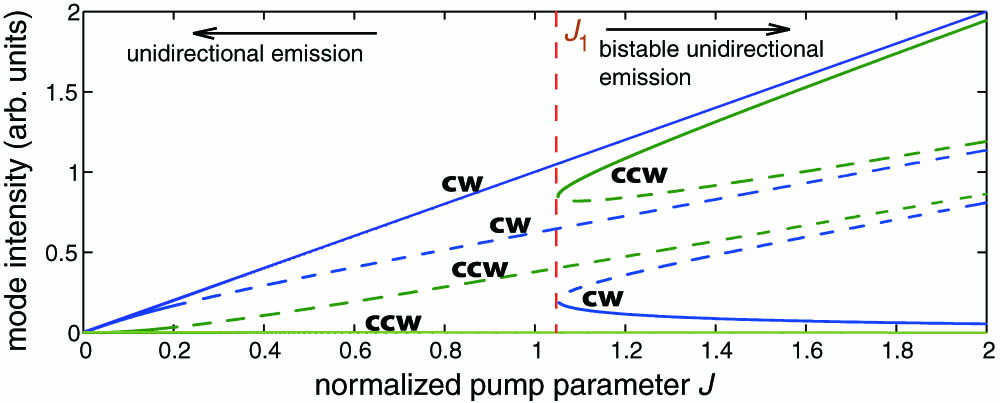
Fig. 2. Intensity of cw and ccw ring modes versus normalized pump parameter J at an EP (κ2/κ1=0) for α=3. Solid and dashed curves refer to stable and unstable branches of stationary solutions, respectively. For J<J1, the only stable solution corresponds to unidirectional laser emission in the cw mode (E2=0), whereas for J>J1, bistable unidirectional emission, with either dominant cw or ccw modes, is observed. The value of J1 depends on the linewidth enhancement factor α solely according to Eq. (14).
Fig. 3. Same as Fig. 2 but for κ2/κ1=0.5, Θ=0, and α=3. For J<J2≃0.33, all stationary solutions are unstable and the unidirectional TWM emission is destabilized by a Hopf instability. Laser emission in the dominant cw mode is realized in the pump parameter range of J2<J<J1.
Fig. 4. Behavior of the directionality D versus coupling ratio κ2/κ1 for a linewidth enhancement factor of α=3. The directionality is calculated close to the second laser threshold, i.e., for J=J2+.
Fig. 5. Numerically computed behavior of the normalized pump parameter J1, corresponding to the bistability boundary (upper curves, filled circles), and of J2, corresponding to the “second” laser threshold (Hopf instability boundary, open circles), versus κ2/κ1 for Θ=0 and for a few values of the linewidth enhancement factor. (a) α=1, (b) α=2, and (c) α=3. The region embedded between the upper and lower curves corresponds to stable laser emission in the dominant cw mode. The lower and upper curves touch at κ2/κ1=1 (not shown in the figures).
Fig. 6. (a) Numerically computed bifurcation diagram showing the extreme (maxima/minima) of amplitudes |E1,2(t)| for cw and ccw TWMs versus normalized injection current μ. Parameter values are given in the text. For μ≳1.37, a stationary regime, corresponding to almost unidirectional emission in the cw mode, is observed, whereas for μ≲1.37, the dynamics are oscillatory. (b) Numerically computed time evolution of mode intensities |E1,2(t)|2 for cw (thin solid line) and ccw (thick solid line, with lower amplitude) for increasing values of the normalized injection current μ. The laser is switched on at time t=0, with the initial condition corresponding to small random amplitudes of E1 and E2 and N=0.