
Longqing Cong, Guizhen Xu. Toroidal Dipole in Hybrid Bound States in the Continuum[J]. Laser & Optoelectronics Progress, 2023, 60(18): 1811021
- Laser & Optoelectronics Progress
- Vol. 60, Issue 18, 1811021 (2023)
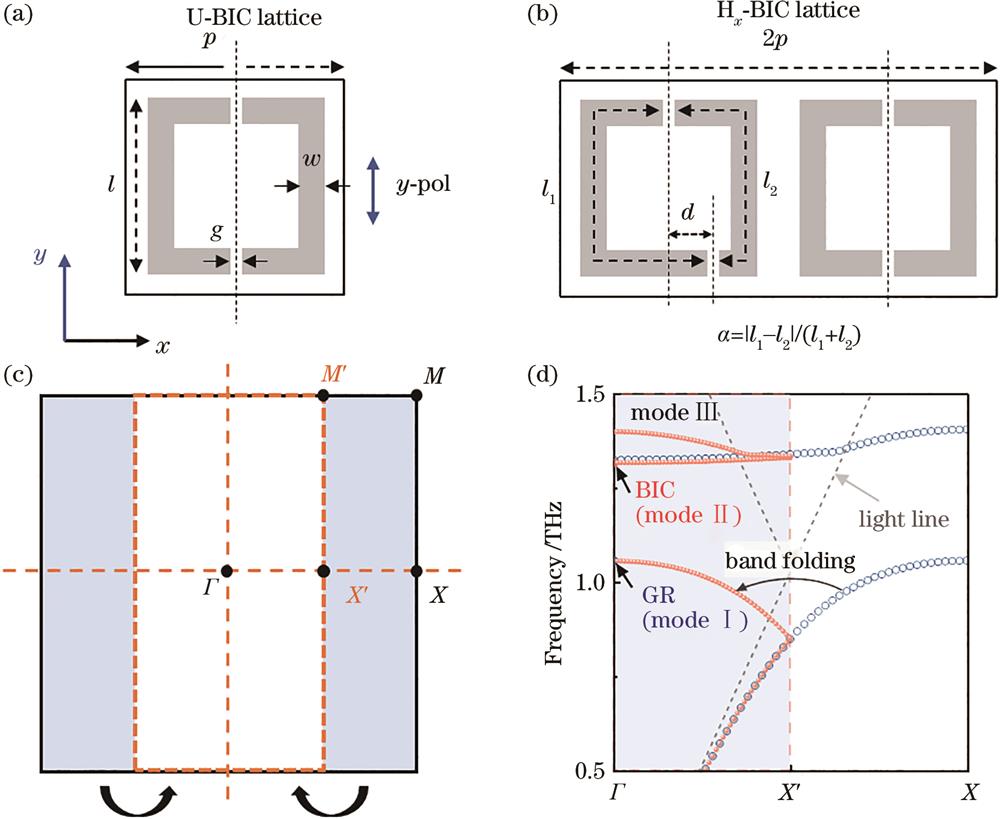
Fig. 1. Schematic diagrams of Hx-BIC metasurfaces and band folding. (a) One unit cell of U-BIC lattice composed of DSRRs, where period p=73 μm and length l= 60 μm; (b) one unit cell of Hx-BIC lattice composed of dual DSRRs along x axis in a supercell, α=|l1-l2|/(l1+l2), represents asymmetry parameter, where l1 and l2 denote the total lengths of left and right metallic branches of DSRRs; (c)band folding of Brillouin zone, where the X-point of a single atomic lattice is folded into a diatomic superlattice BZ Γ point; (d) band structure diagrams and their folding relationships of U-BIC lattice (blue circles) and Hx-BIC lattice (orange dots), where gray dotted line represents light line. Perfect electric conductor and structures without substrate were used for DSRRs in simulations to calculate eigenvalues
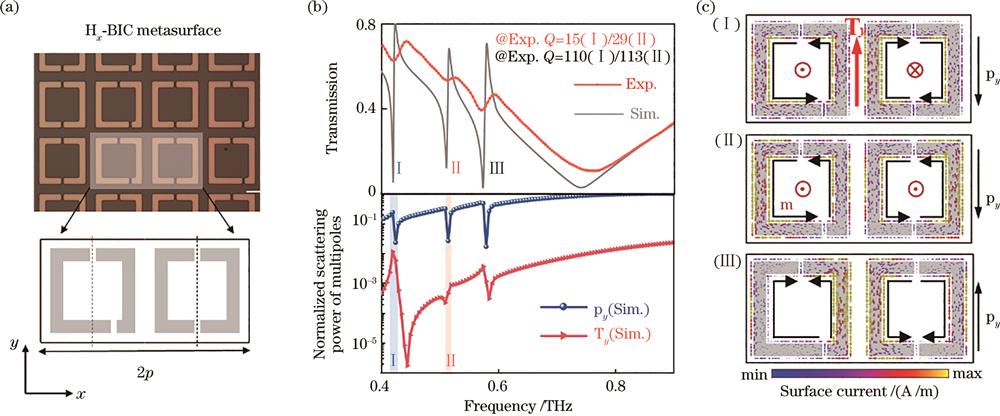
Fig. 2. Experimental and simulated results of Hx-BIC metasurface. (a) Microscopic images of Hx-BIC metasurfaces; (b) amplitude transmission spectra of experimental (orange dotted line) and numerical simulations (gray solid line), and normalized scattering power of multipoles from simulations; (c) surface current distributions of three resonances with y-polarized incidence
Fig. 3. Numerical simulation results. (a) Relationship curve between the Q corresponding to resonance I (blue) and resonance II (orange) obtained from electromagnetic simulation and α; (b) relationship curve between the py and Ty components at the intrinsic frequencies of resonance I (blue) and resonance II (red) and α
Fig. 4. Simulation and experimental results of Hy-BIC metasurfaces. (a) Hy-BIC lattice composed of dual DSRRs along y axis, where period p=73 μm, length l= 60 μm, and d = 15 μm (α = 0.128), the inset depicts the band folding of Hy-BIC lattice from U-BIC lattice; (b) surface current distributions of three resonances in Hy-BIC metasurfaces with y-polarized incidence; (c) amplitude transmission spectra of experimental (orange dotted line) and numerical simulations (gray solid line) and the normalized scattering power of multipoles from simulations; (d) relationship curve between the Q corresponding to resonance I (blue) and resonance II (orange) and α; (e) relationship curve between the scattering intensity of py and Tx components at the intrinsic frequencies of resonance I (blue) and resonance II (red) and α


Set citation alerts for the article
Please enter your email address

© Copyright 2018-2021 | Chinese Laser Press. All Rights Reserved 沪ICP备15018463号-20