
Hongwei Zhang, Xiaoxia Li, Bin Zhu, Yang Zhang. Two-stage object tracking method based on Siamese neural network[J]. Infrared and Laser Engineering, 2021, 50(9): 20200491
- Infrared and Laser Engineering
- Vol. 50, Issue 9, 20200491 (2021)
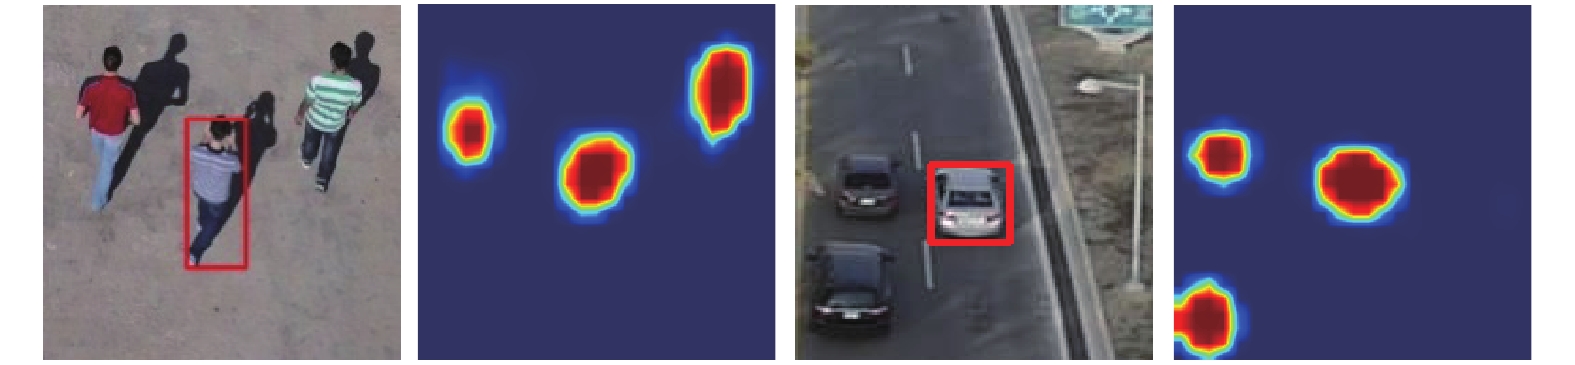
Fig. 1. Classification response map of SiamRPN
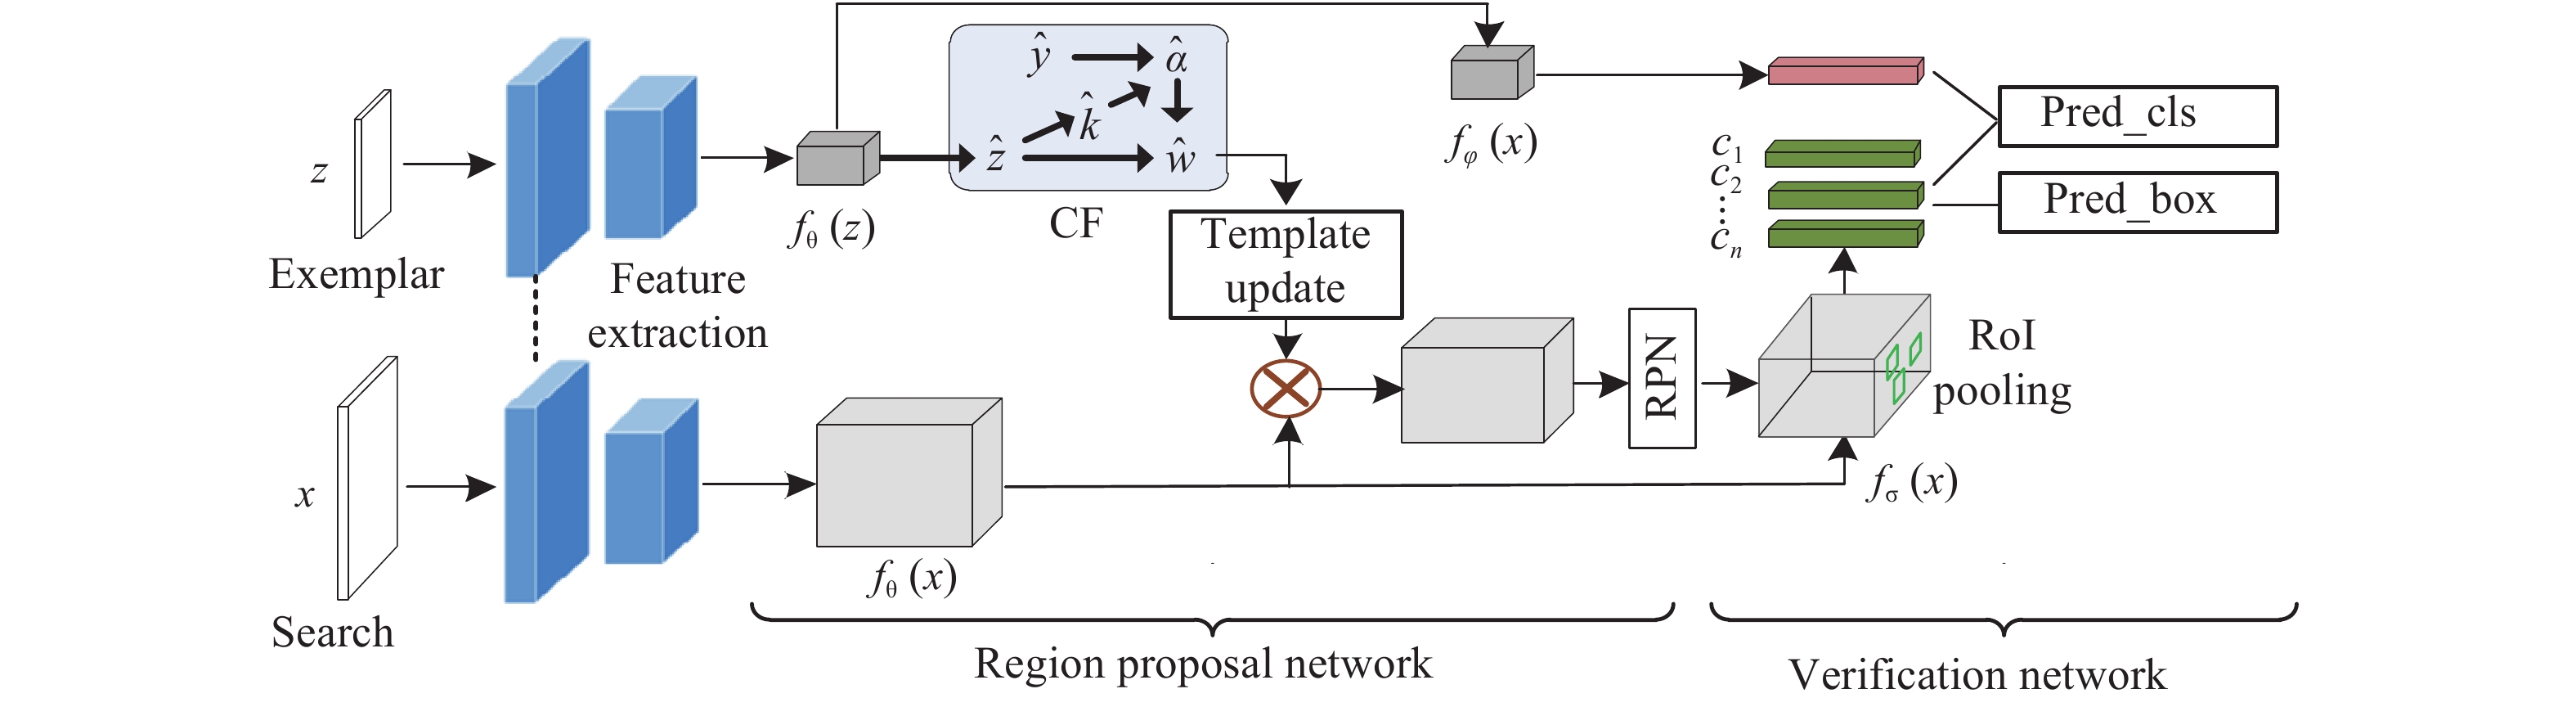
Fig. 2. Schematic diagram of the two-stage tracking method based on Siamese network
Fig. 3. Features extracted by different networks
Fig. 4. Comparative analysis of network outputs after applying correlation filter modulation
Fig. 5. Schematic diagram of the verification network
Fig. 6. Comparison of classification distances of the inter-object and intra-object
Fig. 7. Comparison of classification distance between different sampling groups
Fig. 8. Evaluation on the OTB100 benchmark: Precision plot and success plot
Fig. 9. AR scores in baseline test condition
Fig. 10. Overlap rate curves in unsupervised condition
Fig. 11. Test results on the UAV123 dataset: Precision plot and success plot
Fig. 12. Qualitative evaluation of challenging sequences
Fig. 13. Ability to deal with the similar interference of the two-stage Siamese network
Fig. 14. Comparison of regression precision of the two-stage Siamese network
Fig. 15. Running time test of each module
| |||||||||||||||||||||||||||||||||||||||||||||||||||||||||||||||||||||||||||||||||||||||||||||||||||||||||||
Table 1. Evaluation results on the VOT benchmark

Set citation alerts for the article
Please enter your email address
© Copyright 2018-2021 | Chinese Laser Press. All Rights Reserved 沪ICP备15018463号-20