
Cuijun Zhang, Na Zhao. Improved GrabCut Algorithm Based on Probabilistic Neural Network[J]. Laser & Optoelectronics Progress, 2021, 58(2): 0210024
- Laser & Optoelectronics Progress
- Vol. 58, Issue 2, 0210024 (2021)
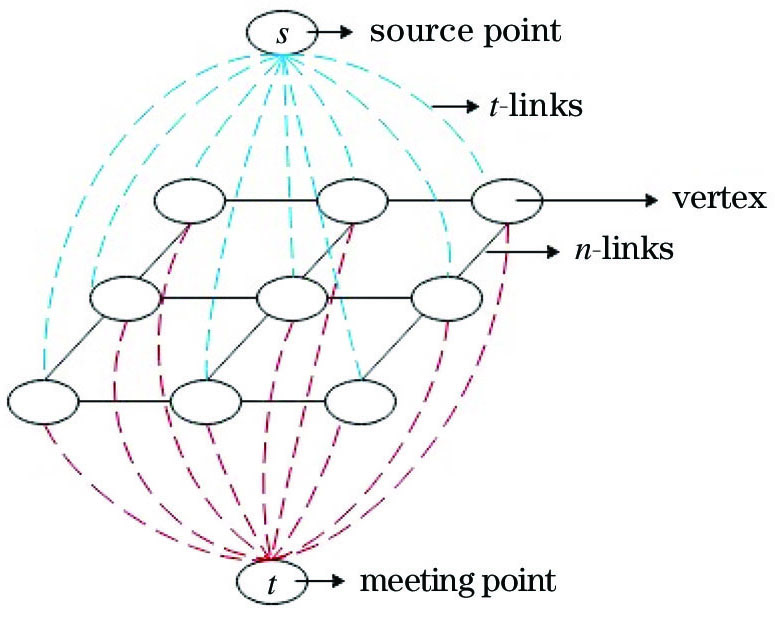
Fig. 1. Structure of image G
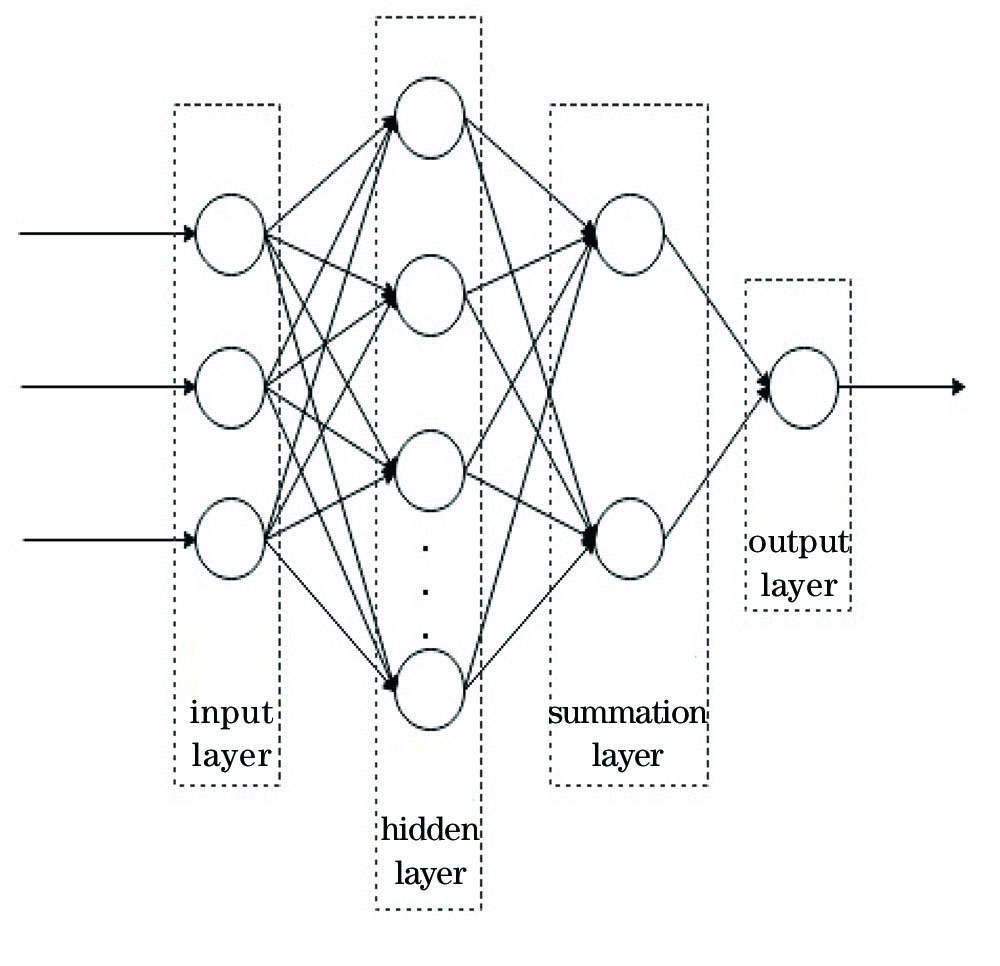
Fig. 2. Structure diagram of the PNN
Fig. 3. Grayscale histograms of foreground and background. (a) Original image; (b) grayscale histogram of the foreground; (c) grayscale histogram of the background
Fig. 4. Flow chart of PNN_GrabCut algorithm
Fig. 5. Experimental example. (a) Original image; (b) label image
Fig. 6. Segmentation results of different algorithms. (a) Original image; (b) GrabCut algorithm; (c) PNN_GrabCut algorithm; (d) algorithm of Ref. [12]; (d) algorithm of Ref. [16]
Fig. 7. Segmentation results of different algorithms. (a) Original image; (b) GrabCut algorithm; (c) PNN_GrabCut algorithm
|
Table 1. Statistics of the high pixel value in foreground
|
Table 2. Statistics of the high pixel value in background
|
Table 3. Experimental data
|
Table 4. PNN prediction results at different σ(experiment1)
|
Table 5. PNN prediction results at different σ (experiment2)
|
Table 6. Average F1 and running time of different algorithms

Set citation alerts for the article
Please enter your email address
© Copyright 2018-2021 | Chinese Laser Press. All Rights Reserved 沪ICP备15018463号-20