
Bo Zhang, Zhi-Meng Zhang, Wei-Min Zhou. Quantum splitting of electron peaks in ultra-strong fields[J]. Matter and Radiation at Extremes, 2023, 8(5): 054003
- Matter and Radiation at Extremes
- Vol. 8, Issue 5, 054003 (2023)
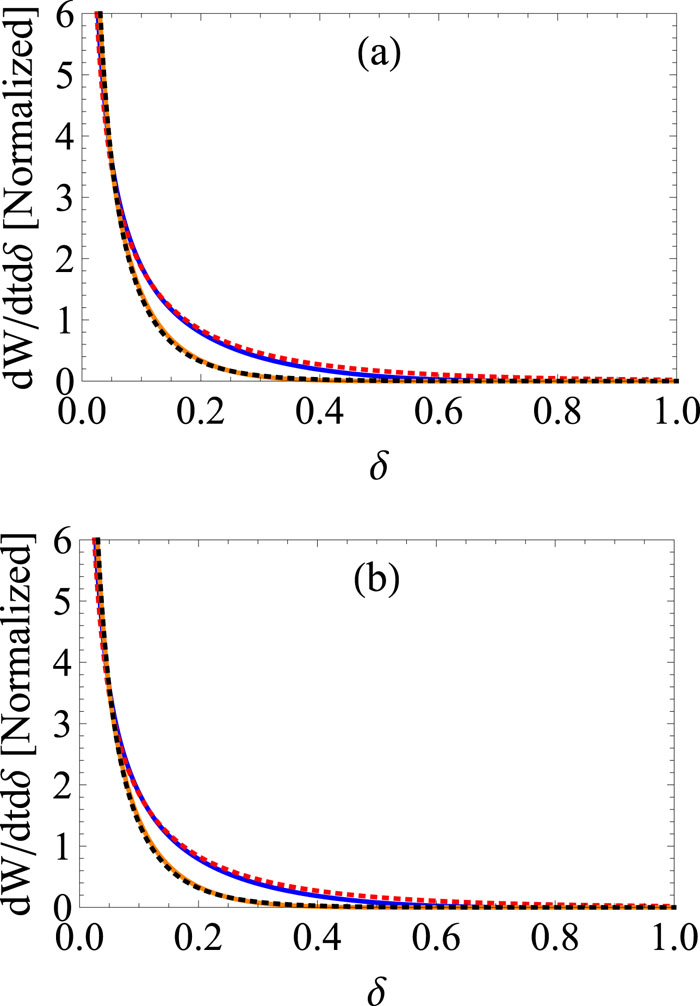
Fig. 1. (a) Comparison of normalized differential radiation probability of NCS (orange/blue solid curves for χ = 0.1/0.3) with the approximation (black/red dotted curves for χ = 0.1/0.3). (b) Comparison of normalized differential radiation probability of QSR (orange/blue solid curves for χ = 0.1/0.3) with the approximation (black/red dotted curves for χ = 0.1/0.3).

Fig. 2. (a) Comparison of P i distributions given by simulations (symbols) and their analytic approximations (curves) of p 0 = 1.5 GeV electrons propagating 1–4 μ m (r = 1.15, 2.3, 3.45, and 4.6) perpendicularly in a λ 0 = 800 nm, circularly polarized laser with I = 1 × 10²¹ W/cm2. (b) Functions f i .
Fig. 3. Comparison of the analytic formulas (curves) and simulations (symbols) for the electron spectrum after multiple NCS. Electrons with p 0 = 0.5 GeV (a), 1.0 GeV (b), 2.0 GeV (c), and 5.0 GeV (d) propagate perpendicularly through the waist of a λ = 800 nm circularly polarized laser that lasts for τ = 30 fs. The peak laser intensity is 5 × 10²⁰ W/cm2 and the laser waist is 3.6 μ m. χ 0 = a 0p 0k 0/m 2 is 0.05, 0.1, 0.2 and 0.5, respectively, in (a)–(d).
Fig. 4. Peak splitting process. (a), (b), and (c) Spectra of a 1 GeV electron beam after it has propagated respectively D = 2, 3, and 4 μ m perpendicularly in a λ = 800 nm circularly polarized laser with I = 4 × 10²¹ W/cm2, corresponding respectively to r = 4.6, 6.9, and 9.2. (d), (e), and (f) Spectra for respectively all electrons, i ≤ 3 electrons, and i ≥ 4 electrons in the whole peak splitting process. The curves in (d) show the peaks given by classical theory (white dot-dashed), analytic quantum theory (blue dashed), and simulation (gray solid). (g) Normalized spectra of emitted γ rays after the electron beam has propagated different distances.
Fig. 5. Sketches of (a) conventional and (b) new diagrams for quantum radiation reaction stages. The purple lines are peaks of the electron spectrum, r is the average number of emissions, and η is the energy normalized by the primary energy.


Set citation alerts for the article
Please enter your email address

© Copyright 2018-2021 | Chinese Laser Press. All Rights Reserved 沪ICP备15018463号-20