
Hongyu Chen, Haibo Luo, Bin Hui, Zheng Chang. Automatic parts selection method based on multi-feature fusion[J]. Infrared and Laser Engineering, 2021, 50(8): 20200407
- Infrared and Laser Engineering
- Vol. 50, Issue 8, 20200407 (2021)
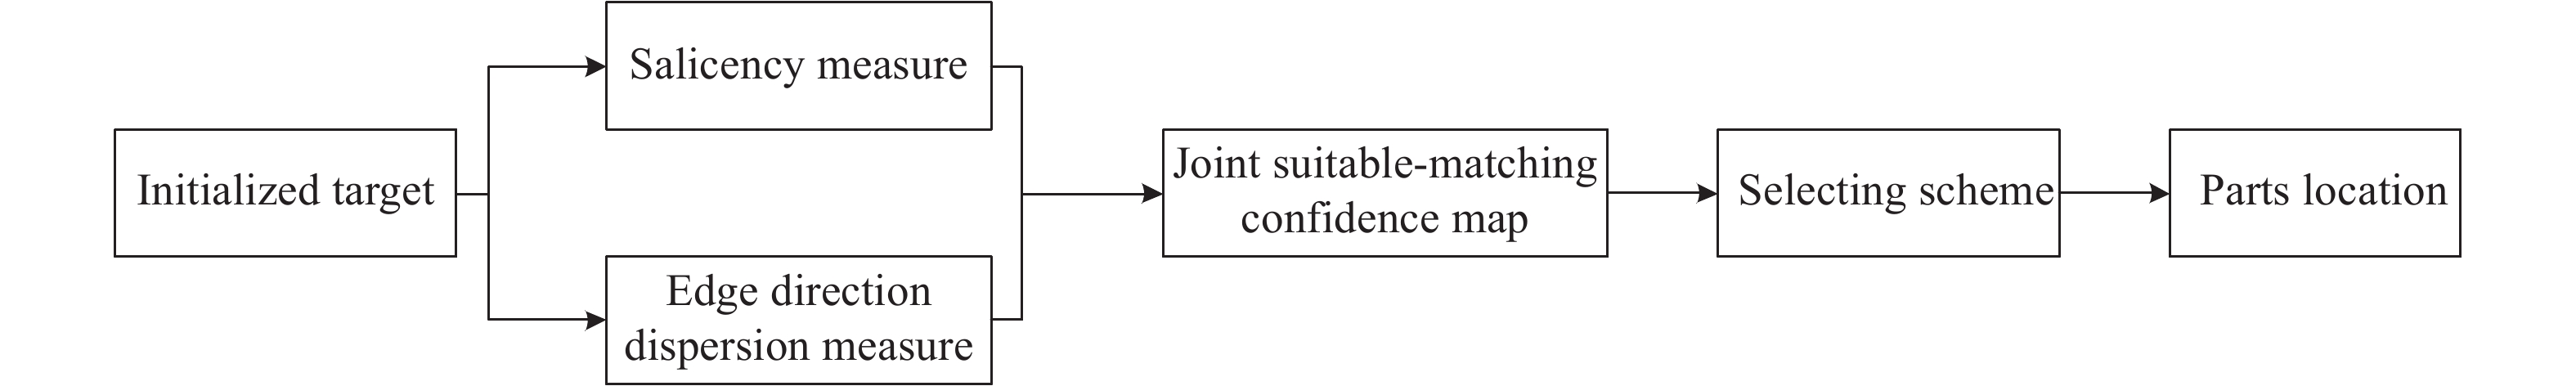
Fig. 1. Algorithm flow chart
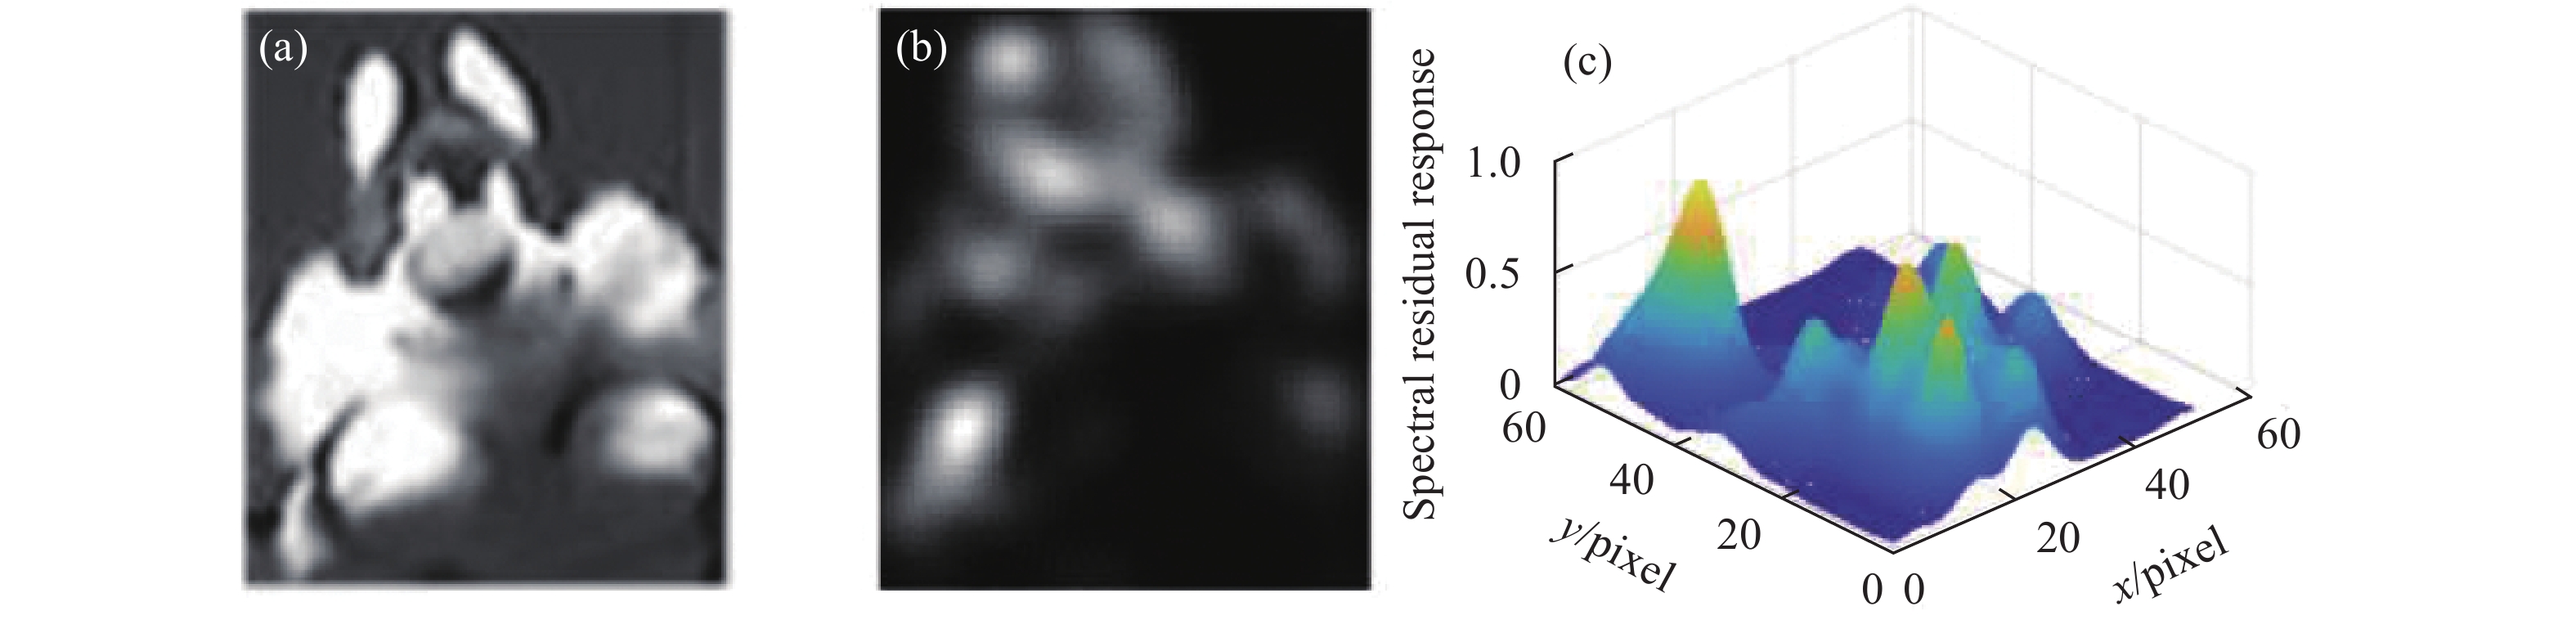
Fig. 2. Response map based on spectral residual visual saliency. (a) Initialized target map; (b) Spectral residual response map; (c) Three-dimensional map of spectral residual response
Fig. 3. Illustration of image texture detail. (a) Binary image of Canny edge; (b) Gradient direction amplitude map; (c) Edge direction dispersion map; (d) Three-dimensional map of edge direction dispersion
Fig. 4. Illustration of joint suitable-matching confidence map based on multi-feature fusion. (a) Joint suitable-matching confidence map; (b) Three- dimensional map of joint suitable-matching confidence
Fig. 5. Result of automatic parts selection
Fig. 6. Experimental results of proposed method on OTB100 dataset. (a) Results of automatic parts selection on sequence Carscale; (b) Results of automatic parts selection on sequence Dancer2
Fig. 6. [in Chinese]
Fig. 7. Experimental results of proposed method on FLIR Thermal dataset. (a) Results of automatic parts selection on the infrared target #1; (b) Results of automatic parts selection on infrared target #2
Fig. 8. Experimental results of proposed method on private infrared sequences. (a) Results of automatic parts selection on the private infrared sequence #1; (b) Results of automatic parts selection on the private infrared sequence #2
Fig. 9. Distance precision and overlap success rate curves of different algorithms under deformation and occlusion attribute. (a) Distance precision curve of deformation attribute; (b) Overlap success rate curve of deformation attribute; (c) Distance precision curve of occlusion attribute; (d) Overlap success rate curve of deformation attribute
Fig. 10. Frame-by-frame center location errors of parts from proposed in the paper and manual selection in different sequences
|
Table 1. Principle of adaptive selection of parts
|
Table 2. Mean center location error in different sequences


Set citation alerts for the article
Please enter your email address

© Copyright 2018-2021 | Chinese Laser Press. All Rights Reserved 沪ICP备15018463号-20