• Laser & Optoelectronics Progress
  • Vol. 58, Issue 23, 2314006 (2021)
Dapeng Wen1, Xiyin Liang1、*, Maogen Su2, Fuchun Yang2, Tianchen Zhang1, Ruilin Chen1, and Meng Wu1
Author Affiliations
  • 1Engineering Research Center of Gansu Province for Intelligent Information Technology and Application, College of Physics and Electronic Engineering, Northwest Normal University, Lanzhou, Gansu 730070, China
  • 2Key Laboratory of Atomic and Molecular Physics & Functional Material of Gansu Province, College of Physics and Electronic Engineering, Northwest Normal University, Lanzhou, Gansu 730070, China
  • show less
    DOI: 10.3788/LOP202158.2314006 Cite this Article Set citation alerts
    Dapeng Wen, Xiyin Liang, Maogen Su, Fuchun Yang, Tianchen Zhang, Ruilin Chen, Meng Wu. Classification of Ores Using Laser-Induced Breakdown Spectroscopy Combined with PCA-PSO-SVM[J]. Laser & Optoelectronics Progress, 2021, 58(23): 2314006 Copy Citation Text show less
    Flow of PSO-SVM classification model
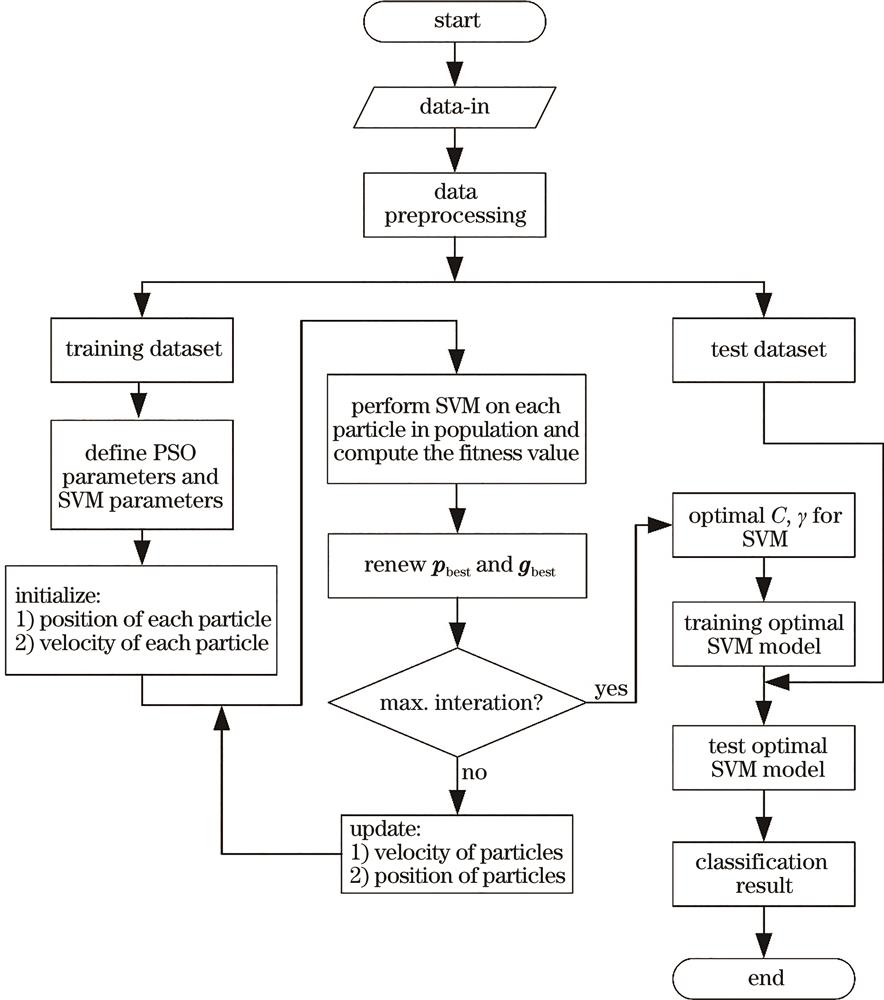
    Fig. 1. Flow of PSO-SVM classification model
    LIBS spectra of 12 types of ore samples
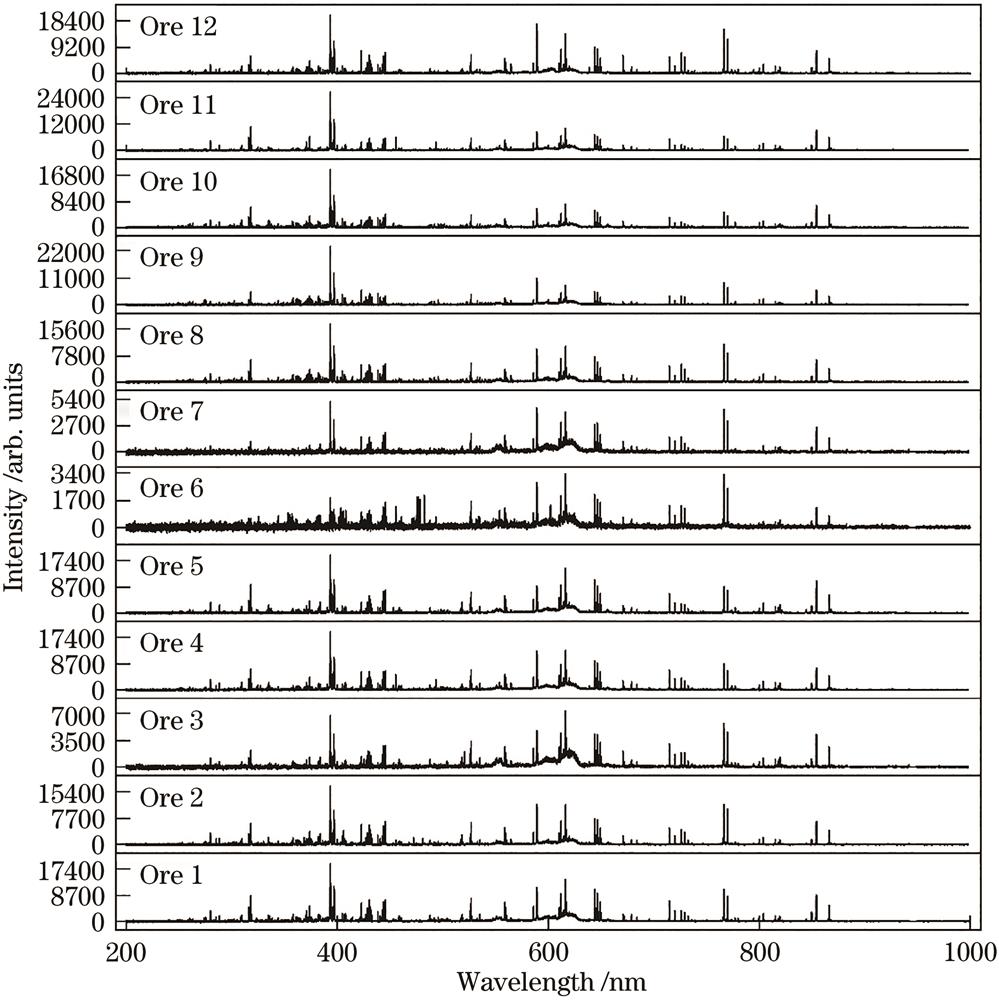
    Fig. 2. LIBS spectra of 12 types of ore samples
    LIBS spectra of U ore. (a) Original spectrum; (b) spectrum after preprocessing
    Fig. 3. LIBS spectra of U ore. (a) Original spectrum; (b) spectrum after preprocessing
    PCA analysis results of LIBS data for 12 types of ores. (a) Each principal component score and the cumulative score of principal components; (b) three-dimensional scatter plot of the first three principal components
    Fig. 4. PCA analysis results of LIBS data for 12 types of ores. (a) Each principal component score and the cumulative score of principal components; (b) three-dimensional scatter plot of the first three principal components
    PCA-PSO-SVM recognition results on 12 types of ores. (a) PSO optimizing results; (b) PCA-PSO-SVM recognition results
    Fig. 5. PCA-PSO-SVM recognition results on 12 types of ores. (a) PSO optimizing results; (b) PCA-PSO-SVM recognition results
    Comparison of number of errors in ore classification by three classification models
    Fig. 6. Comparison of number of errors in ore classification by three classification models
    Ore category labelOre nameOre category labelOre nameOre category labelOre name
    Ore 1U oreOre 5Au-Cu oreOre 9Hematite ore
    Ore 2Zn-Pb-Ag sulfide oreOre 6Mn oreOre 10Anomalous ferruginous ore
    Ore 3Ni-Cu oreOre 7Gold oxide oreOre 11Silver copper gold ore
    Ore 4Sn oreOre 8Zinc sulfide oreOre 12Skarn tungsten magnetite ore
    Table 1. Ore category information in the dataset
    Numbers of variablesCumulative interpretation rate /%Average accuracy rate /%
    394.6341.46
    596.1676.88
    1097.6498.54
    1598.0399.79
    2598.2399.92
    5098.4799.77
    Table 2. PSO-SVM recognition results with different input variables
    ModelMean errorAverage classification time /sAverage classification accuracy /%
    PCA-LDA7.001.6098.54
    PCA-PSO-BP5.583.0398.84
    PCA-PSO-SVM0.4610.7699.90
    Table 3. Recognition results of three classification models
    Dapeng Wen, Xiyin Liang, Maogen Su, Fuchun Yang, Tianchen Zhang, Ruilin Chen, Meng Wu. Classification of Ores Using Laser-Induced Breakdown Spectroscopy Combined with PCA-PSO-SVM[J]. Laser & Optoelectronics Progress, 2021, 58(23): 2314006
    Download Citation