Author Affiliations
1State Key Laboratory of High Field Laser Physics, Shanghai Institute of Optics and Fine Mechanics, Chinese Academy of Sciences, Shanghai 201800, China2Center of Materials Science and Optoelectronics Engineering, University of Chinese Academy of Sciences, Beijing 100049, China3CAS Center for Excellence in Ultra-intense Laser Science, Shanghai 201800, China4ShanghaiTech University, Shanghai 201210, China5e-mail: jill@siom.ac.cn6e-mail: ruxinli@mail.siom.ac.cnshow less
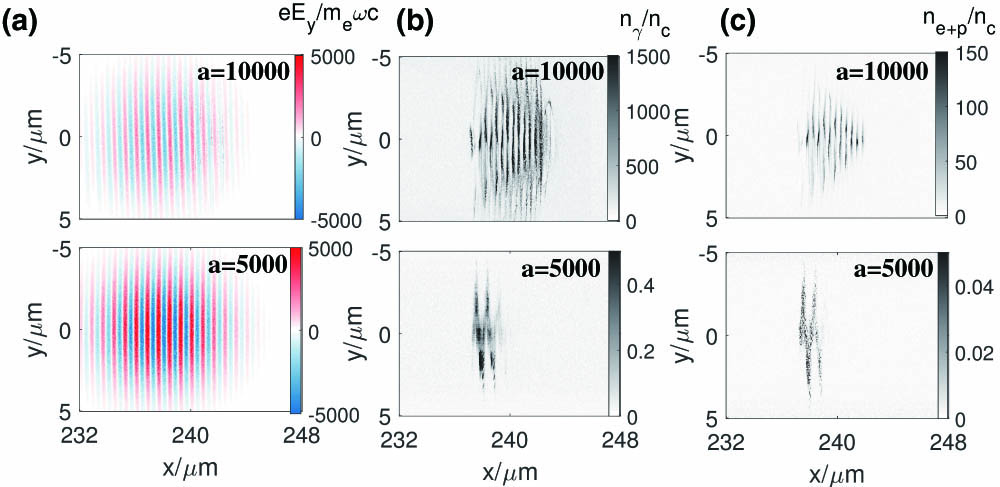
Fig. 1. Distributions of (a) laser electric fields Ey (b) γ photons density nγ as well as (c) electron–positron density ne+p at tf=300T0 and ne0=1011 cm−3 for a=10000 (top panel) and a=5000 case (bottom panel), respectively. The Ey is normalized by meωc/e, while densities are normalized by critical density nc.
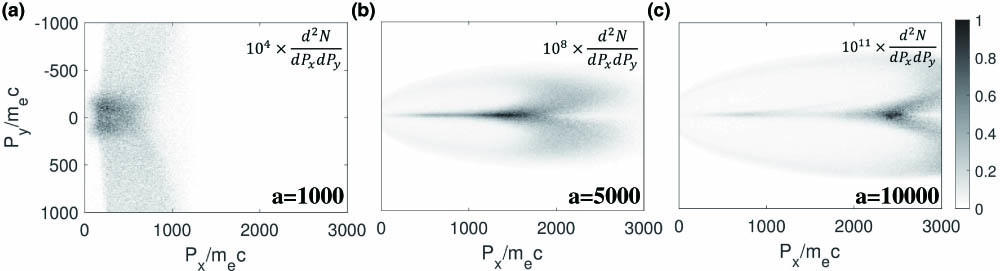
Fig. 2. Electron number density in the momentum space Px−Py at focusing time tf and ne0=1011 cm−3 for (a) a=1000, (b) a=5000, and (c) a=10,000, respectively. The Px and Py are normalized by mec.
Fig. 3. (a) Ne+p and (b) Nγ evolution for a=5000 (blue solid and pentagrams) and a=10,000 (red dashed and squares) obtained from simulation (symbols) and theoretical analysis (lines); (c) ratio between the measured peak intensity in simulations and the designed one as a function of designed peak intensity under electron densities of ne0=1015 cm−3 (blue dotted and squares), 1013 cm−3 (red dashed and pentagrams), 1011 cm−3 (black solid and circles). The symbols are results measured from simulation while lines are from the theoretical model. All symbols represent average values for ten simulation cases with different random seeds, while the error bars represent peak intensity quantile of 95% and 5% (error bar gives a confidence interval of 90%), separately. (d) The theoretical prediction of peak intensity distributions as a function of the designed peak intensity and ne0 (from 6×10⁷ to 1015 cm−3).
Fig. 4. (a) Obtained peak intensity evolution at a=6000 for different vacuum electron densities ne0. The black circles, red pentagrams, and blue squares represent average peak intensity measured in simulations. The solid black line, dashed red line, and dotted blue line denote theoretical analysis with ne0=1011, 1013, and 1015 cm−3, respectively. The pink triangles represent 3D simulation results before simulation memory overflow with ne0=1011 cm−3 [a 40 μm (x)×40 μm (y)×40 μm (z) window with 2000cells×400cells×400cells]. (b) The theoretically predicted peak intensity evolution from analytical model as a function of designed peak intensity at ne0=109 cm−3.