
Yan Gao, Xiaoyue Xiao, Xiaohu Li, Hong Zhu, Jin Tang, Fan Guo. Research on the stitching method of massive aerial far-infrared images with an inconsistent overlap rate[J]. Infrared and Laser Engineering, 2022, 51(7): 20210611
- Infrared and Laser Engineering
- Vol. 51, Issue 7, 20210611 (2022)
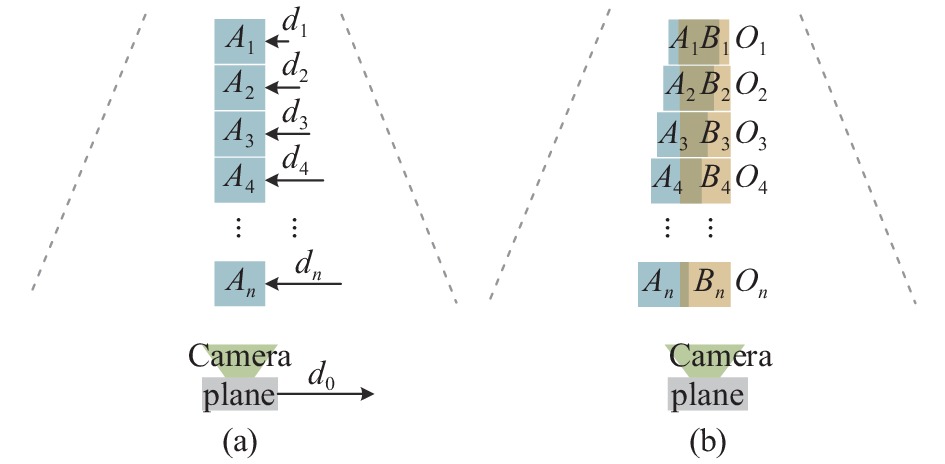
Fig. 1. Principle of perspective results in inconsistent transverse overlap of image
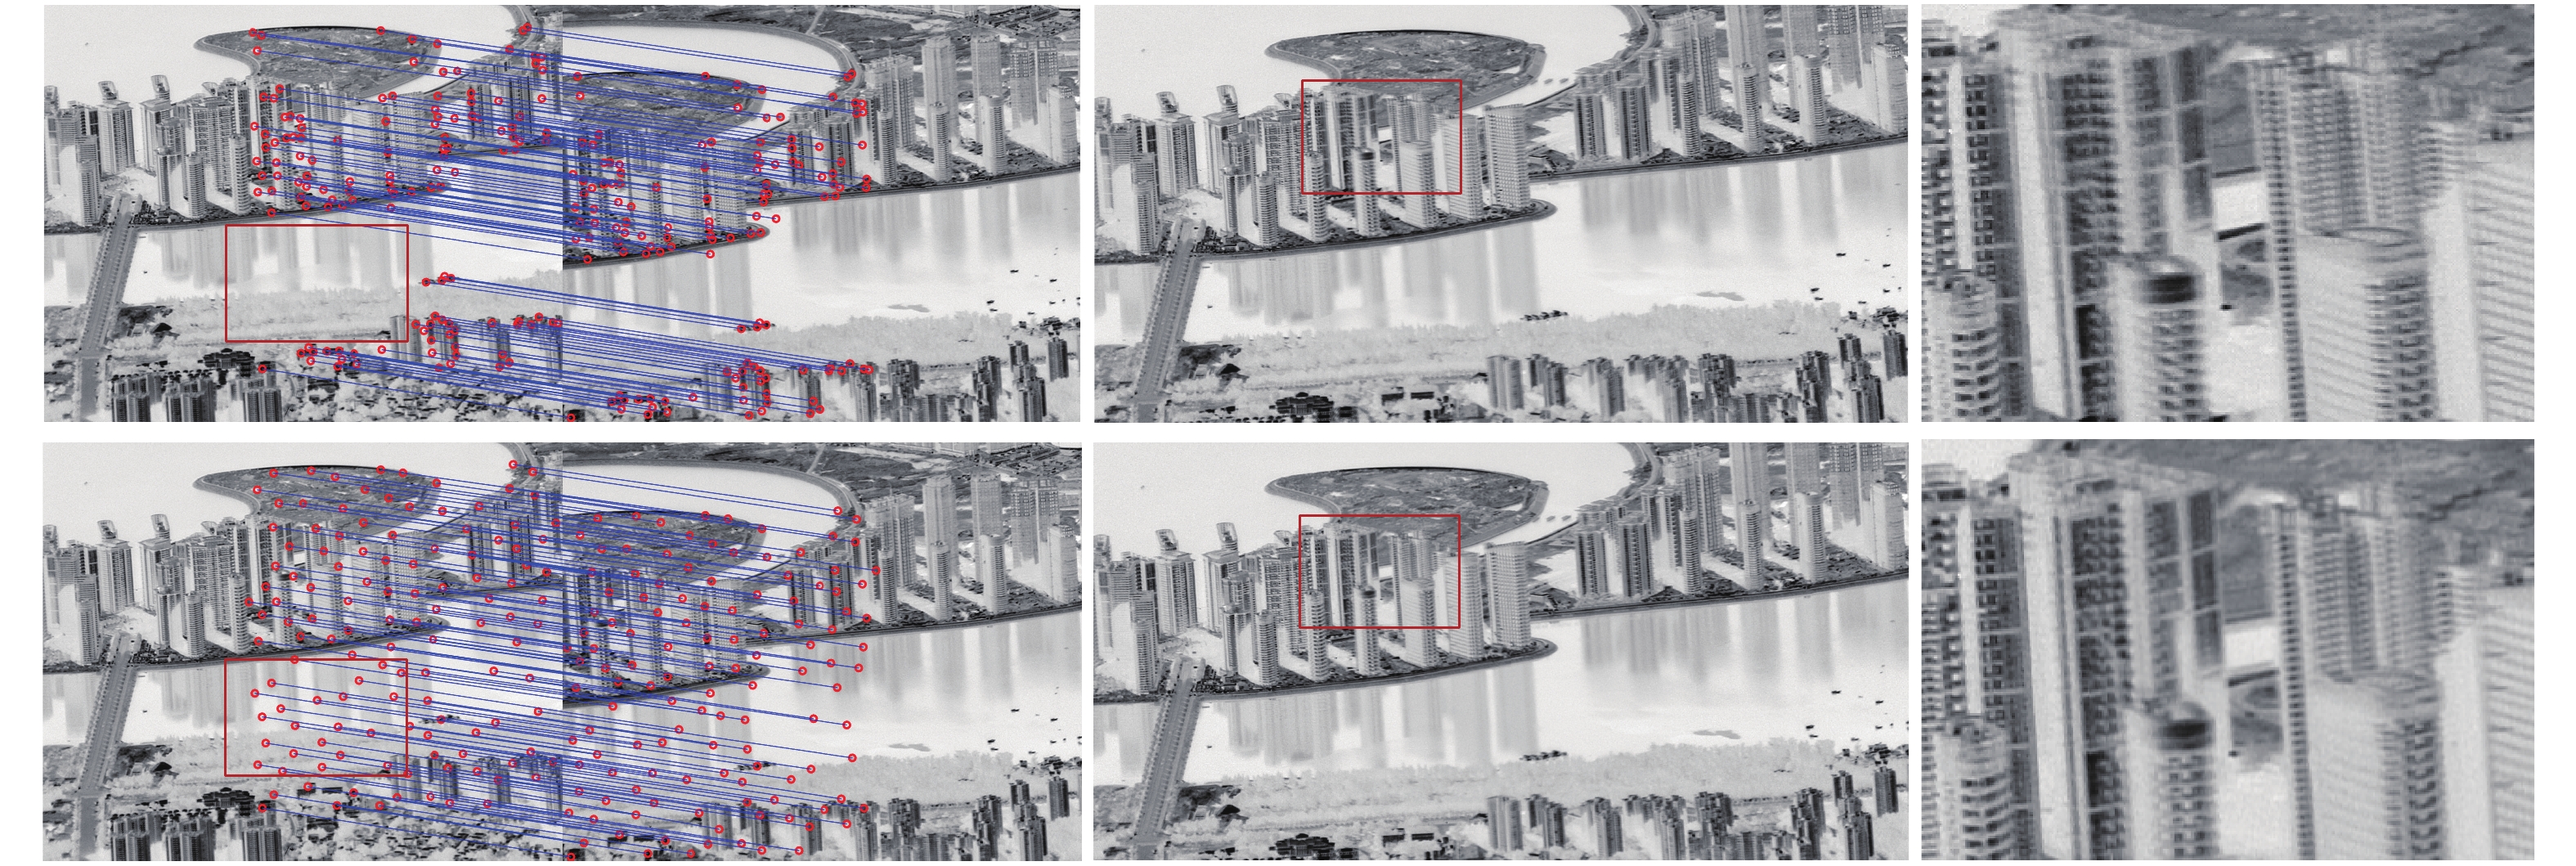
Fig. 2. Comparison of the effect of uniform distribution of features on alignment ability
Fig. 3. Registration schematic diagram of non-uniform overlap rate
Fig. 4. Diagram of regional division
Fig. 5. Overlapping and alternating phenomenon
Fig. 6. Schematic diagram of grid transformation recursion and inter column splicing
Fig. 7. Flow chart of stitching
Fig. 8. Comparison of sequential image stitching
Fig. 9. Comparison of stitching results of single column image stitching and inter column image
Fig. 10. Far-infrared image pair for contrast experiment
Fig. 11. Comparison of registration results
Fig. 12. Influence of different distribution functions on edge distortion
Fig. 13. Comparison of gray correction map
Fig. 14. Comparison of the first far-infrared image mosaic results
Fig. 15. Comparison of the sceond far-infrared image mosaic results
|
Table 1. Weight distribution of homography matrix
|
Table 2. Number comparison of multi-column image mosaic with various methods
|
Table 3. Comparison of far-infrared image stitching speed

Set citation alerts for the article
Please enter your email address
© Copyright 2018-2021 | Chinese Laser Press. All Rights Reserved 沪ICP备15018463号-20