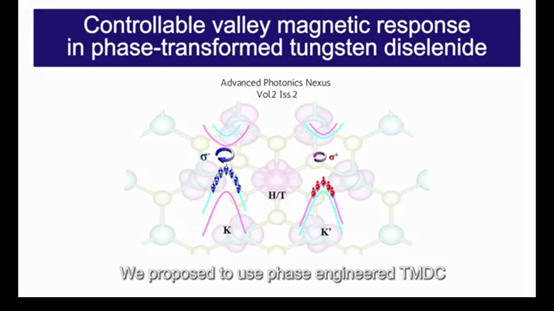
Abstract
Achieving valley pseudospin with large polarization is crucial in the implementation of quantum information applications. Transition metal dichalcogenides (TMDC) with different phase structures provide an ideal platform for valley modulation. The valley splitting has been achieved in hybrid phase WSe2, while its valley polarization remains unstudied. Magnetic field controllable valley polarization is explored in WSe2 with coexistence of H and T phases by an all-optical route. A record high valley polarization of 58.3% is acquired with a 19.9% T phase concentration under a 4-T magnetic field and nonresonant excitation. The enhanced valley polarization is dependent on the phase component and shows various increasing slopes, owing to the synergy between the T phase WSe2 and the magnetic field. The magnetic field controlled local magnetic momentums are revealed as the mechanism for the large valley polarization in H / T-WSe2. This speculation is also verified by theoretical simulations of the nonequilibrium spin density. These results display a considerable valley magnetic response in phase-engineered TMDC and provide a large-scale scheme for valley polarization applications.
Video Introduction to the Article
1 Introduction
Inversion symmetry breaking, strong spin–orbit coupling, and time inversion symmetry give rise to two nonequivalent valleys ( and ) with antiparallel spins in monolayer transition metal dichalcogenides (TMDCs).1–3 Regulating the valley dynamics has attracted considerable attention in recent years.4,5 Polarization-resolved photoluminescence (PL) used to optically encode and unbalance the spin population in the two valleys can express the carried binary information by the intensity of emitted lights. Realization high valley contrast is the key to establishing a promising platform for both optoelectronic and spintronic applications.
The strategies for enhancing the valley contrast mainly focus on suppressing the intervalley scattering by plasmonic metasurface,6,7 defects and strain engineering,8,9 or breaking the inversion symmetry by electrical modulation, twist staking, and heterojunction construction.10,11 Alternatively, applying a magnetic field to induce nonequilibrium spin states through the Zeeman field is considered an essential method for regulating the valley dynamics. However, due to the semiconductor property of H phase TMDC materials, a high magnetic field is generally necessary to achieve a larger valley polarization.12 Further, combining with the spin injection through a magnetic heterojunction or ferromagnetic electrode, the magnitude of a required magnetic field can be reduced by taking advantage of the injected nonequilibrium spin carriers.13–15 Nevertheless, the complicated growth process and specially designed structures result in the lattice mismatch and poor integrability of devices. Meanwhile, the clean interface and conductivity matching are indispensable for efficient spin injection, which are difficult to control precisely in the magnetic heterojunction. To introduce the spin electrons, we came up with idea of bringing in the T phase into origin H phase monolayer of TMDC. Instead of applying additional conditions on TMDC, the phase engineering could modify the intrinsic structure of materials to enhance the valley magnetic response. Compared with the H phase TMDC, the T phase with partial filling of the nonbonding bands16–20 can be modulated sensitively by the magnetic field and induce net spin in the hybrid H/T system. The synergy between the internal magnetic component and the external magnetic field will considerably increase the effective Zeeman field, promote the exchange interaction, and enhance the valley polarization of TMDC.15,21,22 As a result, the valley splitting has been verified in hybrid-phase TMDC, demonstrating its potential application in valleytronics.23 However, there is still a lack of detailed valley magnetic response study on the valley polarization of hybrid-phase TMDC. In addition, H/T hybrid phase TMDC can be easily prepared by the chemical vapor deposition (CVD) method followed by a controllable plasma treatment or alkali metal intercalation,24–28 which will be a feasible, convenient, and scalable method for regulation of the valley magnetic response in TMDC materials.
In this work, large-scale monolayers with controllable components are synthesized. The structure with the higher T phase concentration is demonstrated to possess larger valley polarization and higher sensitivity to the external magnetic field. A record high degree of valley polarization is achieved in monolayer with 19.9% T phase concentrations. The density functional theory (DFT) simulations indicate the higher electron concentration and nonequilibrium spin density as incorporating the T phase. The local magnetic momentums arranged by external magnetic field are considered as the mechanism for the enhanced valley magnetic response and thus the large valley polarization in hybrid .
Sign up for Advanced Photonics Nexus TOC. Get the latest issue of Advanced Photonics Nexus delivered right to you!Sign up now
2 Results and Discussion
2.1 Synthesis of Hybrid Phase Monolayer H/T-WSe2
Monolayer with an H/T hybrid phase is prepared through a CVD synthesis followed by a moderate plasma treatment (detailed in Sec. 4). As the optical morphology shows in Fig. 1(a), film after plasma treatment exhibits a uniform thickness contrast and a large scale of more than in lateral size. The atomic force microscopy (AFM) characterization is performed to confirm its monolayer thickness, as provided in Fig. S1 in the Supplementary Material. Figure 1(b) shows the high-resolution transmission electron microscopy (HRTEM) image of the film. The lattices clearly display two different configurations of hexagon honeycomb and zigzag chain, corresponding to the H and T phase , respectively.29,30 Selected area electron diffraction (SAED), shown in Fig. 1(c), has two coexisting hexagonal patterns, which also verify the contribution from the H and T phases, respectively.29 Moreover, the phase component can be well controlled by adjusting the plasma power and treatment time. As is analyzed by X-ray photoelectron spectroscopy (XPS) in Fig. 1(d), two monolayers with different T phase components are verified. Among the four characteristic peaks of , the blue set located at 34.5 and 32.4 eV corresponds to the H phase , and the purple set centered at 33.8 and 31.7 eV corresponds to the T phase. The gray area presents the traces of oxidized tungsten. By fitting the area of XPS peaks, the T phase components are estimated to be 12.2% and 19.9% T, respectively.31 So far, the structure of is confirmed by intuitive transmission electron microscopy (TEM) observation and quantitative XPS analysis.

Figure 1.(a) Optical topography of the CVD-grown large-scale monolayer on surface, where the tweezer trace shows the distinction between film and the substrate. (b), (c) HRTEM image and SAED pattern of monolayer . (d) XPS of monolayer . The blue and purple shadows correspond to the components of H and T phases, respectively. (e) curves of monolayer and with the T-phase components of 12.2% and 19.9%. (f) Atomic structure of monolayer , and the differential charge densities of top Se, W, and bottom Se atomic layers. The scale bar from blue to red denotes the change from depletion to accumulation.
Considering that higher electron concentration will be beneficial to the valley polarization, the current–voltage () property is further studied to estimate the conductivity of the samples. Figure 1(e) exhibits a larger slope of the curve for 19.9% of the T-phase sample, indicating that the electron concentration is increased with the increasing T-phase component. This can be attributed to the metallicity of the introduced T phase. Local interaction between the T- and H-phase W atoms ( and ) is investigated from the calculated layer-dependent 2D charge distribution, as shown in Fig. 1(f). It can be found that the top three Se atoms of the T phase possess fewer electrons by about 0.03 e than other Se atoms, and the six nearest-neighbor atoms around the atoms lose fewer electrons by about 0.07 e than other atoms. The charge–transfer interactions predict the ability to control the properties of through the introduced T phase.
2.2 Characterization of Valley Polarization
Valley polarization enhancement in with different T-phase concentrations (12.2% and 19.9%) is verified through the circularly polarized PL spectra at 10 K, as shown in Fig. 2. Each spectrum exhibits a single peak around 1.72 eV, consistent with the energy of the neutral exciton (). No additional defect peak or the change of peak position is observed before and after the phase transition, which indicates that the defect number produced by the plasma treatment should be small and its influence on the valley polarization should be negligible. The degree of valley polarization is quantitatively evaluated according to the expression for left-handed circularly polarized excitation () or for right-handed circularly polarized excitation (), where () and () denote the intensities of circularly polarized emissions with a co- and cross-polarized configurations, respectively. The intrinsic valley polarization is calculated as 9.0% [Figs. S2(a) and S2(b) in the Supplementary Material] for and further promotes to 12% [Figs. S2(c) and S2(d) in the Supplementary Material] when the T-phase component increases to 19.9%. It is also noteworthy that the valley polarization is controllable under the external magnetic field. Compared with the co-polarized signal, the suppression of the cross-polarized peak under the magnetic field is a signature of modulation on the optical valley polarization in .3,32–34 Taking the as an instance, the valley polarization varies from 45.4% to 58.3% when the magnetic field increases from 1 to 4 T, and the maximum value of 58.3% is obtained for the excitation under a magnetic field of 4 T [Figs. 2(a)–2(d)]. A similar enhanced trend is also found for the magnetic field increased from to [Figs. 2(e)–2(h)]. It should be noted that the obtained valley polarization in is much larger than that of pure ,35 and the maximum value is record-high under the nonresonant excitation so far.13,36,37
Figure 2.Circularly polarized PL spectra of under (a)–(d) positive magnetic fields from 1 to 4 T and (e)–(h) negative magnetic field from to −4 T. The blue and purple lines indicate co- and cross-polarized configurations, respectively.
The magnetic field-dependent valley polarizations with excitation are compared and depicted in Figs. 3(a) and 3(b) for different T-phase concentrations. The results at 0 T are 11.3% [Fig. 3(a)] and 12.0% for and [Fig. 3(b)], respectively, and the evolution curves exhibit as a “V” pattern with different slopes from −4 to for both the samples. Specifically, in , the valley polarization increases sharply from 0 to 1 T () with a slope of 0.30 (0.28). As the magnetic field further increases, the increasing trend of valley polarization becomes smooth, corresponding to the slopes of 0.08 from to , and 0.02 from to . Compared with the former case, is more sensitive to the magnetic field, exhibiting a larger slope of 0.46 from 0 to , and gradually decreased slopes of 0.06 from to and 0.02 from to . A similar phenomenon is also observed for the excitation, as shown in Fig. S3 in the Supplementary Material.
Figure 3.Magnetic-dependent polarization of (a) and (b) under excitation with and detection. The red dots indicate the measurement data. The dark blue, light blue, and pink lines show slopes from 0 to , to , and to , respectively. Spin density isosurface plots of (c) and (d) . The W and Se atoms are denoted by the blue and yellow balls, respectively. The isosurface in pink represents the majority spin density. Total spin DOSs of monolayers (e) and (f) , where the pink and blue lines denote the majority and minority spin DOS.
To gain a comprehensive understanding of the role of the magnetic field, the first-principle simulations are performed to compare the spatial distribution of the spin density for monolayer and . As shown in Figs. 3(c) and 3(d), the net spin in is zero, whereas pronounced spin densities are induced by the atom in and distributed around the six nearest atoms. Figures 3(e) and 3(f) show the total spin density-of-states (DOSs) for monolayer before and after the phase transition, respectively. For the , the DOS exhibits a symmetric distribution for the spin-up and spin-down states, indicating a nonmagnetic ground state [Fig. 3(e)]. For , the DOSs split into asymmetric spin-up and spin-down channels, echoing a nonequilibrium distribution in spin density [Fig. 3(f)]. The main contribution of the asymmetric DOSs in is from the 4d state of rather than , as shown in Fig. S4 in the Supplementary Material. In the framework of crystal field theory, has a trigonal prismatic coordination, and the W-4d orbital splits into three energy levels, as shown in Fig. S5 in the Supplementary Material. is an octahedral coordination and the W-4d orbital splits into two energy levels, i.e., double-degenerate and triple-degenerate . The is partly occupied in parallel by the two 4d electrons to reduce the coulomb energy between the 4d electrons, producing a net magnetic moment for the W atom.18 Therefore, the nonequilibrium spin distribution and the induced magnetic moment in the system may be aligned by the external magnetic field, which will facilitate the generation and modulation of the valley polarization.
2.3 Qualitative and Quantitative Analysis of Valley Polarization in H/T-WSe2
Based on the above experimental and simulation results, the enhanced valley polarizations in are qualitatively analyzed in terms of nonequilibrium spin distribution in and quantitatively calculated from the increased electron concentration in , as depicted in Figs. 4(a)–4(e). The Hamiltonian of the valley exciton can be expressed as38The first term, eV, represents the exciton energy (, where is the distance from to point in the first Brillouin zone). in the second term is the exciton mass, and the third term is the pseudospin-independent term. The intervalley electron–hole exchange leads to the fourth term , where the center-of-mass wave vector is represented by and the exciton valley pseudospin is described by the Pauli matrix . The last term is the crucial exchange term describing the additional Zeeman energy induced by the phase transition.
Figure 4.Schematic diagram of magnetic-field-modulated valley dynamic process of monolayer and . (a) SOC-induced valence band splitting in . (b) SOC induced band splitting in with the electron concentration increases due to the introduction of phase in . (c) Magnetic-field-induced exciton dispersion in conduction band and valley splitting in valence band of . (d) Cartoons depicting valley polarization in under the (d) positive and (e) negative magnetic fields, respectively. The thick arrows with single color () denote the asymmetric valley-conserving and the thin arrows () with color gradient denote the valley-flipping exciton formation processes under and excitation.
As is well known, the spin–orbital coupling (SOC) interaction will induce the splitting in the valence band, producing the spin-valley locking effect [Fig. 4(a)] and circular polarization in the PL helicities. with higher electron concentration will involve more electrons in the excitons process, transferring oscillator strength from the exciton to the attractive Fermi polaron, resulting in the polarization enhancement.39 Therefore, the valley polarization can be quantitatively increased with the increasing T-phase concentration under the and excitations, as observed in the above two different components of monolayer . Without the magnetic field, the nonequilibrium spin in generates local magnetic moments with random directions. The overall statistical average should not show a long-range magnetism that can be equivalent to a magnetic field. Under a perpendicular magnetic field, the induced Zeeman energy results in the two-branch exciton dispersion by opening up a finite gap at , as shown in both the conduction and valence bands in Fig. 4(b). Simultaneously, the T-phase component with certain magnetic momentums in acts as local magnetic fields. If these local magnetic momentums can be arranged in a unified direction, a valley splitting of will be acquired [Fig. 4(c)]. Taking the 19.9% T-phase concentration as an example, the maximum is calculated about 38.5 meV, as shown in Fig. S6 in the Supplementary Material. The induced intrinsic nonequilibrium spin distribution is much larger than the latest reported spin injection from or any other intermedium manipulating the valley polarization.13 Therefore, although the absolute value of valley-conserving rate and valley-flipping rate will switch with the change of magnetic field direction, resulting in larger valley polarization for () excitation than for () excitation under positive (negative) magnetic field [Figs. 4(d) and 4(e)], the effect of magnetic field on the valley excitons dispersion is limited. Consequently, the valley polarization increases with both the increased positive or negative magnetic fields, as shown in Figs. 3(a) and 3(b).
According to above analysis, it can be concluded that there are three possible physical processes dominating the polarization: (i) the increased electron concentration. Without the magnetic field, the valley polarization is mainly determined by the optical valley polarization and enhanced by the increased electron concentration, i.e., the T-phase component. (ii) The synergy between the T phase and the external magnetic field. With the magnetic field, the T-phase-induced nonequilibrium spins are well aligned, resulting in an obvious () response with the spin-up (spin-down) electrons. This explains the sharply increased slopes of valley polarization from 0 to , as the dark blue lines shown in Fig. 3(a). (iii) The magnetic field induced Zeeman effect. The initial magnetic field within could already align most of the magnetic momentums of the T phase. As the magnetic field increases further, it will align the rest small part of nonequilibrium spins of the T phase and increases the Zeeman field simultaneously, resulting in a moderate increased slope of valley polarizations from to [light blue lines in Fig. 3(b)]. Although in the magnetic field range from to , only the magnetic-field-induced Zeeman effect dominates the enhancement of valley polarizations, corresponding to even smaller slopes, as the pink lines depict in Figs. 3(a) and 3(b). Thus the enhanced valley polarization is achieved in the lateral . Besides the lateral structure, the valley polarization may also realize a vertical H/T heterostructure. Compared with the strong bonding interaction, the van der Waals interaction in the vertical heterostructure is much weaker, and the induced local magnetic moment may be smaller. However, the contact area of H and T phases in the vertical heterostructure can be larger than that of the lateral one, and there may be new properties and interactions. Therefore, the exploration of valley polarization in vertical H/T phase heterostructure is ongoing.
3 Conclusion
In summary, large-scale monolayer with controllable phase concentrations are synthesized through the CVD method followed by an plasma treatment. The polarized PL spectra suggest a component-dependent valley polarization, which can be further modulated by the external magnetic field. Owing to the enhanced valley magnetic response, a record-high valley polarization of 58.3% is achieved successfully in monolayer under a magnetic field of 4 T and nonresonant excitation. DFT calculations indicate the high electron concentration and nonequilibrium spin density distribution in . Accordingly, three possible physical mechanisms, including the increased electron concentration, the synergy between the T phase and the external magnetic field, and the magnetic-field-induced Zeeman effect are analyzed qualitatively and quantitatively to understand the enhanced valley magnetic response and thus the large valley polarization. All these results fully explore the role of T phase in valley polarization under the effect of external magnetic field, and provide a promising perspective for a large-scale, all-optics-controlled valley dynamic manipulation.
4 Methods
4.1 Preparation of Monolayer H-WSe2 and H/T-WSe2
CVD technology compatible with large-scale growth is used to prepare monolayer on sapphire substrates. Deposited (Alfa Aesar, 99.9%) film on an chip and the Se powder (Aladdin, 99.99%) serve as the precursors of W and Se sources, respectively.23 is obtained based on monolayer through an plasma treatment. The radio-frequency power and flow rate of high pure Ar gas are set as 1 W and 0.5 sccm, respectively, under a 100-Pa background pressure at room temperature. A cold, moderate plasma atmosphere is formed on the surface of , enabling partial H to T phase transition.18,40 Since the formation energies of W and Se vacancy defects are higher than the energy required for the H-to-T phase transition,40–43 the plasma power and time can be well controlled during the plasma treatment process to promote the phase transition rather than forming defects.
4.2 First-Principles Calculations
The differential charge densities of and are calculated using the DFT. The supercells of and monolayers are constructed by considering the measured phase components. The T phase in is introduced by wrenching the Se-W bonds locally by 60 deg around the W atom.44 To avoid the artificial interaction between the periodic slabs, an optimized vacuum layer of 20 Å is set. A Monkhorst–Pack grid of the points is sampled with a mesh in the Brillouin zone, and the plane-wave cutoff energy is set at 500 eV. The residual forces converge to and the energy for structural optimization.
4.3 Characterizations
The morphology and structural characterizations are performed by XPS (Quantum 2000), AFM (SPA400-Nanonavi), and TEM (JEM-2100, 200 kV) techniques. The magnetic-field-dependent circularly polarized PL spectra are obtained at 10 K with a 633-nm laser, and the magnetic fields are applied perpendicularly to the plane of the samples. The optical path diagram is shown in Fig. S7 in the Supplementary Material. For the polarization resolved PL system, the left- and right-handed circularly polarized excitation lights are produced through a linear polarizer and a quarter-wave plate () in the excitation path. The polarization of emission lights is analyzed by the quarter-wave plate and another linear polarizer in the detection path.
Yaping Wu is a professor in the Department of Physics at Xiamen University. She is committed to the research of new semiconductor structural materials and new functional devices. Her SCI-indexed papers have been cited more than 3000 times.
Zhiming Wu is a professor in the Department of Physics at Xiamen University and a deputy director of the Department of Physics. He mainly studies the growth and characteristics of semiconductor nanomaterials, surface structure, spin transport, and solar cells.
Biographies of the authors are not available.
References
[1] X. Xu et al. Spin and pseudospins in layered transition metal dichalcogenides. Nat. Phys., 10, 343-350(2014).
[2] F. K. Mak, J. Shan. Photonics and optoelectronics of 2D semiconductor transition metal dichalcogenides. Nat. Photonics, 10, 216-226(2016).
[3] T. Cao et al. Valley-selective circular dichroism of monolayer molybdenum disulphide. Nat. Commun., 3, 887(2012).
[4] A. Ciarrocchi et al. Excitonic devices with van der Waals heterostructures: valleytronics meets twistronics. Nat. Rev. Mater., 7, 449-464(2022).
[5] S. Zhao et al. Valley manipulation in monolayer transition metal dichalcogenides and their hybrid systems: status and challenges. Rep. Prog. Phys., 84, 026401(2021).
[6] T. Wen et al. Steering valley-polarized emission of monolayer MoS2 sandwiched in plasmonic antennas. Sci. Adv., 6, eaao0019(2020). https://doi.org/10.1126/sciadv.aao0019
[7] M. Deng et al. Plasmonic modulation of valleytronic emission in two-dimensional transition metal dichalcogenides. Adv. Funct. Mater., 31, 2010234(2021).
[8] M. K. McCreary et al. Understanding variations in circularly polarized photoluminescence in monolayer transition metal dichalcogenides. ACS Nano, 11, 7988-7994(2017).
[9] R. C. Zhu et al. Strain tuning of optical emission energy and polarization in monolayer and bilayer MoS2. Phys. Rev. B, 88, 121301(2013). https://doi.org/10.1103/PhysRevB.88.121301
[10] L. Du et al. Engineering symmetry breaking in 2D layered materials. Nat. Rev. Phys., 3, 193-206(2021).
[11] R. J. Schaibley et al. Valleytronics in 2D materials. Nat. Rev. Mater., 1, 16055(2016).
[12] V. A. M. Stier et al. Exciton diamagnetic shifts and valley Zeeman effects in monolayer WS2 and MoS2 to 65 Tesla. Nat. Commun., 7, 10643(2016). https://doi.org/10.1038/ncomms10643
[13] J.-X. Li et al. Electric control of valley polarization in monolayer WSe2 using a van der Waals magnet. Nat. Nanotechnol., 17, 721-728(2022). https://doi.org/10.1038/s41565-022-01115-2
[14] Y. Ye et al. Electrical generation and control of the valley carriers in a monolayer transition metal dichalcogenide. Nat. Nanotechnol., 11, 598-602(2016).
[15] L. O. Sanchez et al. Valley polarization by spin injection in a light-emitting van der Waals heterojunction. Nano Lett., 16, 5792-5797(2016).
[16] X. Wu et al. Recent advances on transition metal dichalcogenides for electrochemical energy conversion. Adv. Mater., 33, 2008376(2021).
[17] S. Cho et al. Phase patterning for ohmic homojunction contact in MoTe2. Science, 349, 6248(2015).
[18] S. Yan et al. Enhancement of magnetism by structural phase transition in MoS2. Appl. Phys. Lett., 106, 012408(2015). https://doi.org/10.1063/1.4905656
[19] V. Kochat et al. Re doping in 2D transition metal dichalcogenides as a new route to tailor structural phases and induced magnetism. Adv. Mater., 29, 1703754(2017).
[20] S. Tongay et al. Magnetic properties of MoS2: existence of ferromagnetism. Appl. Phys. Lett., 101, 123105(2012). https://doi.org/10.1063/1.4753797
[21] I. Khan, B. Marfoua, J. Hong. Electric field induced giant valley polarization in two dimensional ferromagnetic WSe2/CrSnSe3 heterostructure. NPJ 2D Mater. Appl., 5, 10(2021). https://doi.org/10.1038/s41699-020-00195-9
[22] B. Marfoua, J. Hong. Electric filed [sic] dependent valley polarization in 2D WSe2/CrGeTe3 heterostructure. Nanotechnology, 31, 425702(2020). https://doi.org/10.1088/1361-6528/aba0f4
[23] H. Liu et al. Enhanced valley splitting in monolayer WSe2 by phase engineering. ACS Nano, 15, 8244-8251(2021). https://doi.org/10.1021/acsnano.0c08305
[24] J. Y. Park et al. Synthesis of 1T WSe2 on an oxygen-containing substrate using a single precursor. ACS Nano, 16, 11059-11065(2022). https://doi.org/10.1021/acsnano.2c03762
[25] M. Acerce, D. Voiry, M. Chhowalla. Metallic 1T phase MoS2 nanosheets as supercapacitor electrode materials. Nat. Nanotechnol., 10, 313-318(2015). https://doi.org/10.1038/nnano.2015.40
[26] S. Cho et al. Phase patterning for ohmic homojunction contact in MoTe2. Science, 349, 625-628(2015). https://doi.org/10.1126/science.aab3175
[27] W. Li, X. Qian, J. Li. Phase transitions in 2D materials. Nat. Rev. Mater., 6, 829-846(2021).
[28] L. Zhang, J. Dong, F. Ding. Strategies, status, and challenges in wafer scale single crystalline two-dimensional materials synthesis. Chem. Rev., 121, 6321-6372(2021).
[29] Y. Yin et al. Contributions of phase, sulfur vacancies, and edges to the hydrogen evolution reaction catalytic activity of porous molybdenum disulfide nanosheets. J. Am. Chem. Soc., 138, 7965-7972(2016).
[30] J. Luxa et al. Origin of exotic ferromagnetic behavior in exfoliated layered transition metal dichalcogenides MoS2 and WS2. Nanoscale, 8, 1960-1967(2016). https://doi.org/10.1039/C5NR05757D
[31] A. D. Henckel, O. Lenz, M. B. Cossairt. Effect of ligand coverage on hydrogen evolution catalyzed by colloidal WSe2. ACS Catal., 7, 2815-2820(2017). https://doi.org/10.1021/acscatal.7b00074
[32] H. Zeng et al. Valley polarization in MoS2 monolayers by optical pumping. Nat. Nanotechnol., 7, 490-493(2012). https://doi.org/10.1038/nnano.2012.95
[33] F. K. Mak et al. Control of valley polarization in monolayer MoS2 by optical helicity. Nat. Nanotechnol., 7, 494-498(2012). https://doi.org/10.1038/nnano.2012.96
[34] M. A. Jones et al. Optical generation of excitonic valley coherence in monolayer WSe2. Nat. Nanotechnol., 8, 634-638(2013). https://doi.org/10.1038/nnano.2013.151
[35] G. Aivazian et al. Magnetic control of valley pseudospin in monolayer WSe2. Nat. Phys., 11, 148-152(2015). https://doi.org/10.1038/nphys3201
[36] K. Shinokita et al. Continuous control and enhancement of excitonic valley polarization in monolayer WSe2 by electrostatic doping. Adv. Funct. Mater., 29, 1900260(2019). https://doi.org/10.1002/adfm.201900260
[37] M. Manca et al. Enabling valley selective exciton scattering in monolayer WSe2 through upconversion. Nat. Commun., 8, 1-7(2017). https://doi.org/10.1038/ncomms14927
[38] H. Yu et al. Dirac cones and Dirac saddle points of bright excitons in monolayer transition metal dichalcogenides. Nat. Commun., 5, 3876(2014).
[39] P. Back et al. Giant paramagnetism-induced valley polarization of electrons in charge-tunable monolayer MoSe2. Phys. Rev. Lett., 118, 237404(2017). https://doi.org/10.1103/PhysRevLett.118.237404
[40] B. Ouyang. Phase engineering of low dimensional transition metal dichalcogenides(2017).
[41] H. G. Nam. Phase-controlled synthesis for 1T’ phase MoS2 and MoSe2 crystals(2018).
[42] J. Zhu et al. Argon plasma induced phase transition in monolayer MoS2. J. Am. Chem. Soc., 139, 10216-10219(2017). https://doi.org/10.1021/jacs.7b05765
[43] H. Nan et al. Soft hydrogen plasma induced phase transition in monolayer and few-layer MoTe2. Nanotechnology, 30, 034004(2019). https://doi.org/10.1088/1361-6528/aaebc5
[44] L. Cai et al. Vacancy-induced ferromagnetism of MoS2 nanosheets. J. Am. Chem. Soc., 137, 2622-2627(2015). https://doi.org/10.1021/ja5120908