• Acta Optica Sinica
  • Vol. 41, Issue 15, 1506002 (2021)
Fulu Liu1、2, Yumin Zhang1、2, Wei Zhuang1、2, Fei Luo1、2, and Lianqing Zhu1、2、*
Author Affiliations
  • 1Key Laboratory of the Ministry of Education for Optoelectronic Measurement Technology and Instrument, Beijing Information Science & Technology University, Beijing 100016, China;
  • 2Beijing Laboratory of Optical Fiber Sensing and System, Beijing Information Science & Technology University, Beijing 100192, China;
  • show less
    DOI: 10.3788/AOS202141.1506002 Cite this Article Set citation alerts
    Fulu Liu, Yumin Zhang, Wei Zhuang, Fei Luo, Lianqing Zhu. Fiber Temperature Sensor with Composite Structure Based on Vernier Effect and Substrate Sensitization[J]. Acta Optica Sinica, 2021, 41(15): 1506002 Copy Citation Text show less
    Schematic diagram of cascaded FPI+FBG temperature sensor
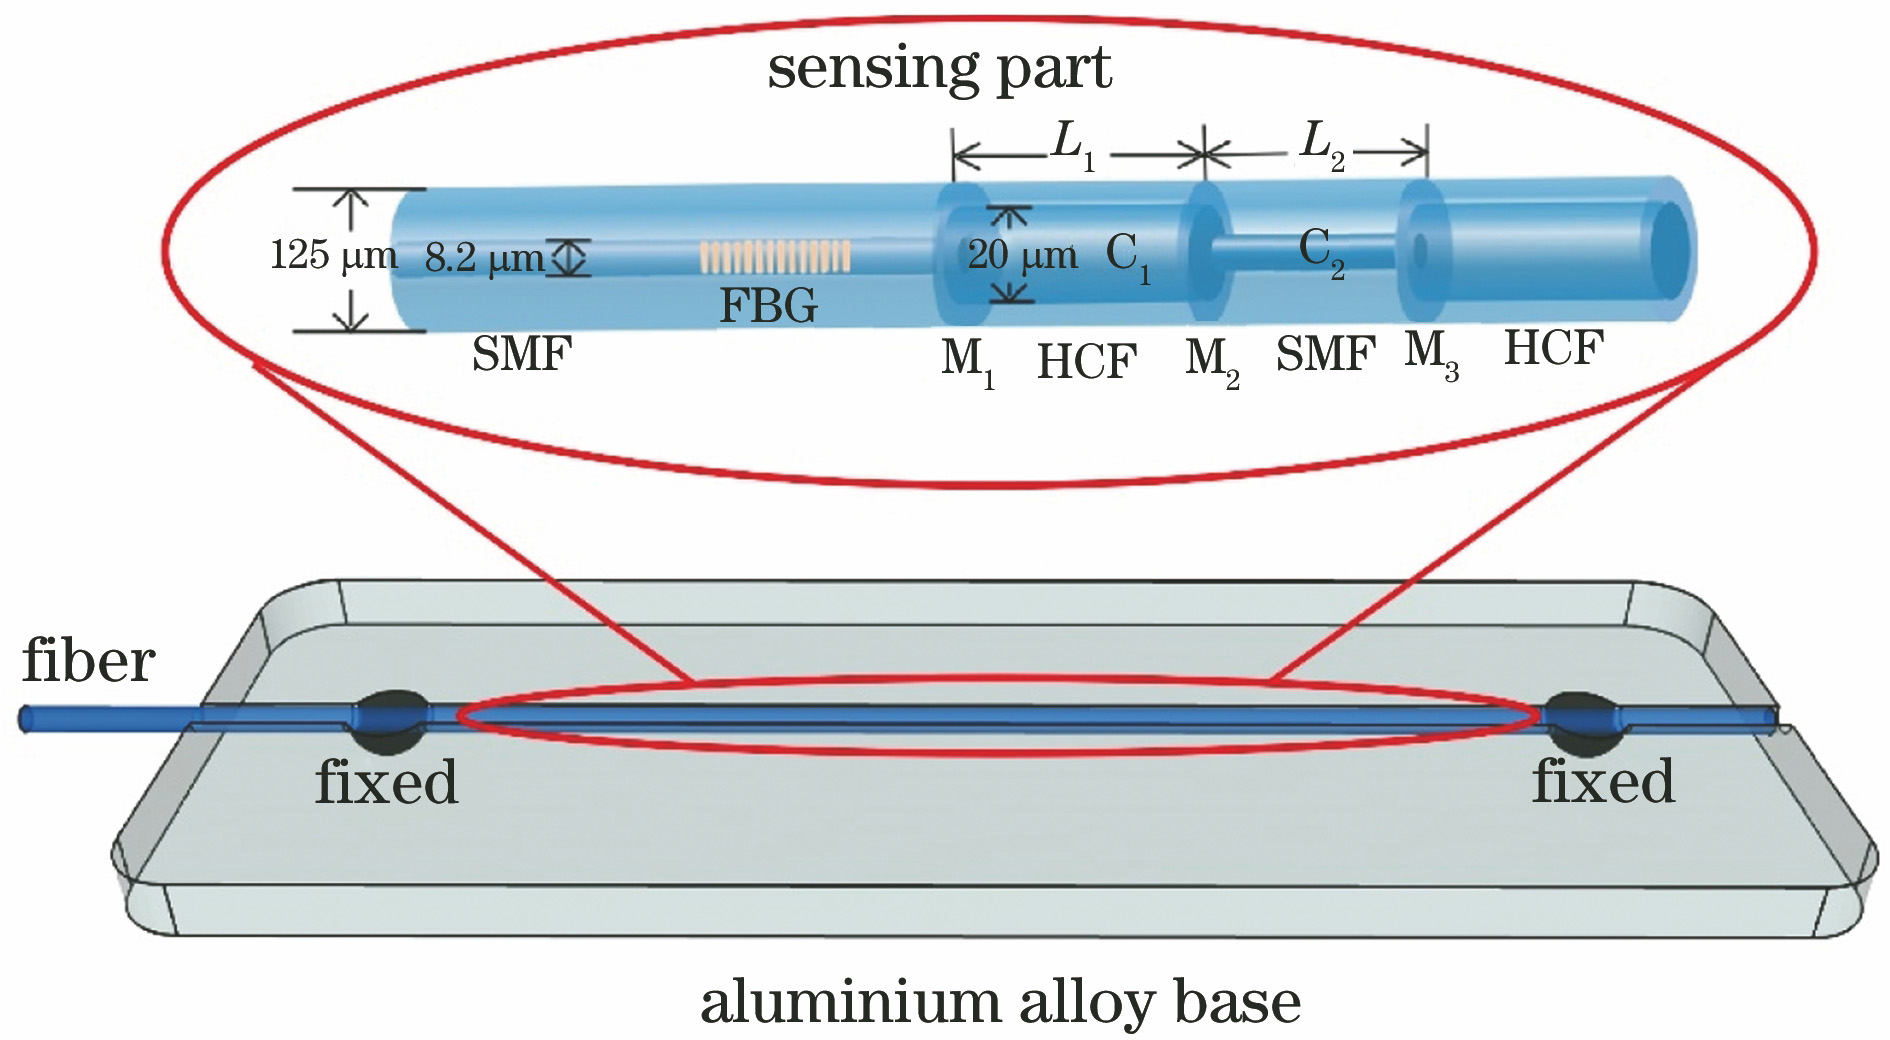
    Fig. 1. Schematic diagram of cascaded FPI+FBG temperature sensor
    Simulated temperature responses of CFPIs based on single air cavity, glass-cavity, and cascaded cavities. (a) Single air cavity; (b) glass-cavity; (c) cascaded cavities
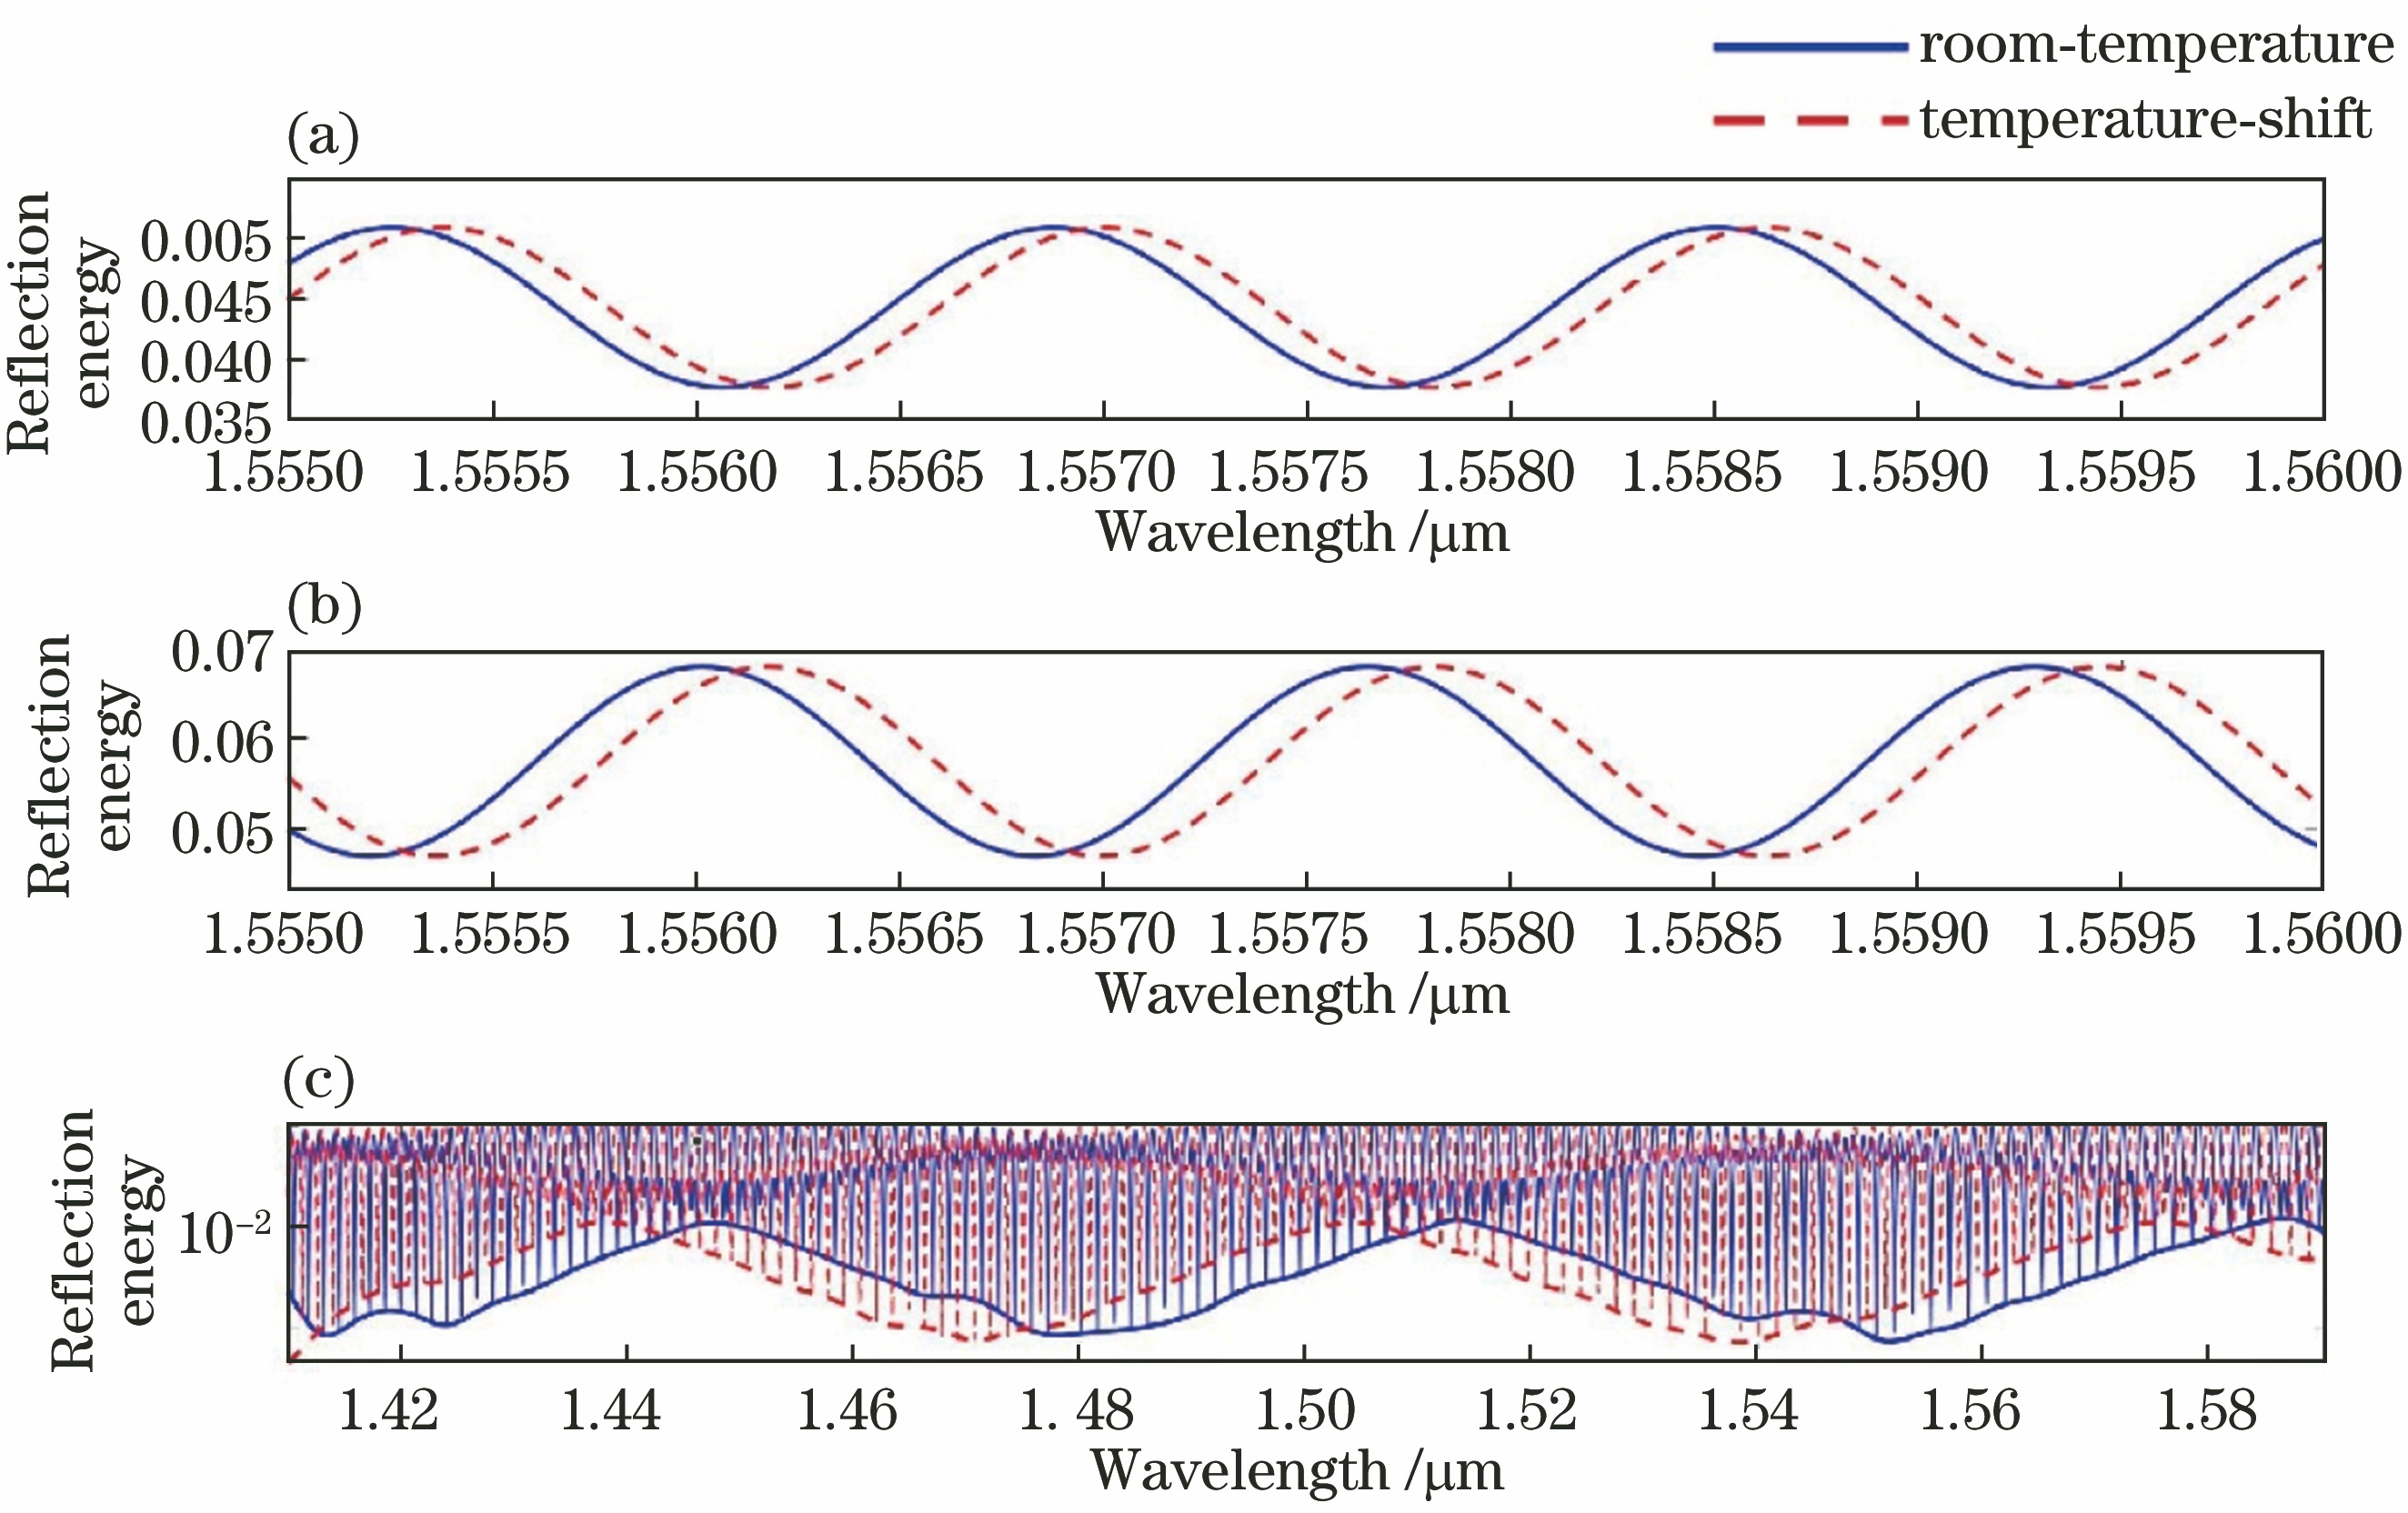
    Fig. 2. Simulated temperature responses of CFPIs based on single air cavity, glass-cavity, and cascaded cavities. (a) Single air cavity; (b) glass-cavity; (c) cascaded cavities
    BPM simulation diagram of the SMF-HCF-SMF structure
    Fig. 3. BPM simulation diagram of the SMF-HCF-SMF structure
    Relationship between temperature sensitivity and parameter M
    Fig. 4. Relationship between temperature sensitivity and parameter M
    Simulation of heat transfer on aluminum alloy substrates
    Fig. 5. Simulation of heat transfer on aluminum alloy substrates
    Simulation of thermal expansion of aluminum alloy substrates
    Fig. 6. Simulation of thermal expansion of aluminum alloy substrates
    Diagram of sensor fabrication process
    Fig. 7. Diagram of sensor fabrication process
    Microscope pictures of the fiber optic sensing section
    Fig. 8. Microscope pictures of the fiber optic sensing section
    Sensor calibration diagram
    Fig. 9. Sensor calibration diagram
    Reflectance spectrogram of the sensor
    Fig. 10. Reflectance spectrogram of the sensor
    Temperature fit curves for FBG and cascaded FPI. (a) FBG; (b) cascaded FPI
    Fig. 11. Temperature fit curves for FBG and cascaded FPI. (a) FBG; (b) cascaded FPI
    Temperature repeatability error box line diagrams for FBG and cascaded FPI. (a) FBG; (b) cascaded FPI
    Fig. 12. Temperature repeatability error box line diagrams for FBG and cascaded FPI. (a) FBG; (b) cascaded FPI
    Relationship between sensor response time and sensor time constant
    Fig. 13. Relationship between sensor response time and sensor time constant
    Comparison of ordinary FBG and post-interference FBG reflection spectra
    Fig. 14. Comparison of ordinary FBG and post-interference FBG reflection spectra
    Fulu Liu, Yumin Zhang, Wei Zhuang, Fei Luo, Lianqing Zhu. Fiber Temperature Sensor with Composite Structure Based on Vernier Effect and Substrate Sensitization[J]. Acta Optica Sinica, 2021, 41(15): 1506002
    Download Citation