
Haiying Qiu, Zhengmao Wu, Tao Deng, Yang He, Guangqiong Xia. Polarization switching characteristics in a 1550 nm VCSEL subject to circularly polarized optical injection[J]. Chinese Optics Letters, 2016, 14(2): 021401
- Chinese Optics Letters
- Vol. 14, Issue 2, 021401 (2016)
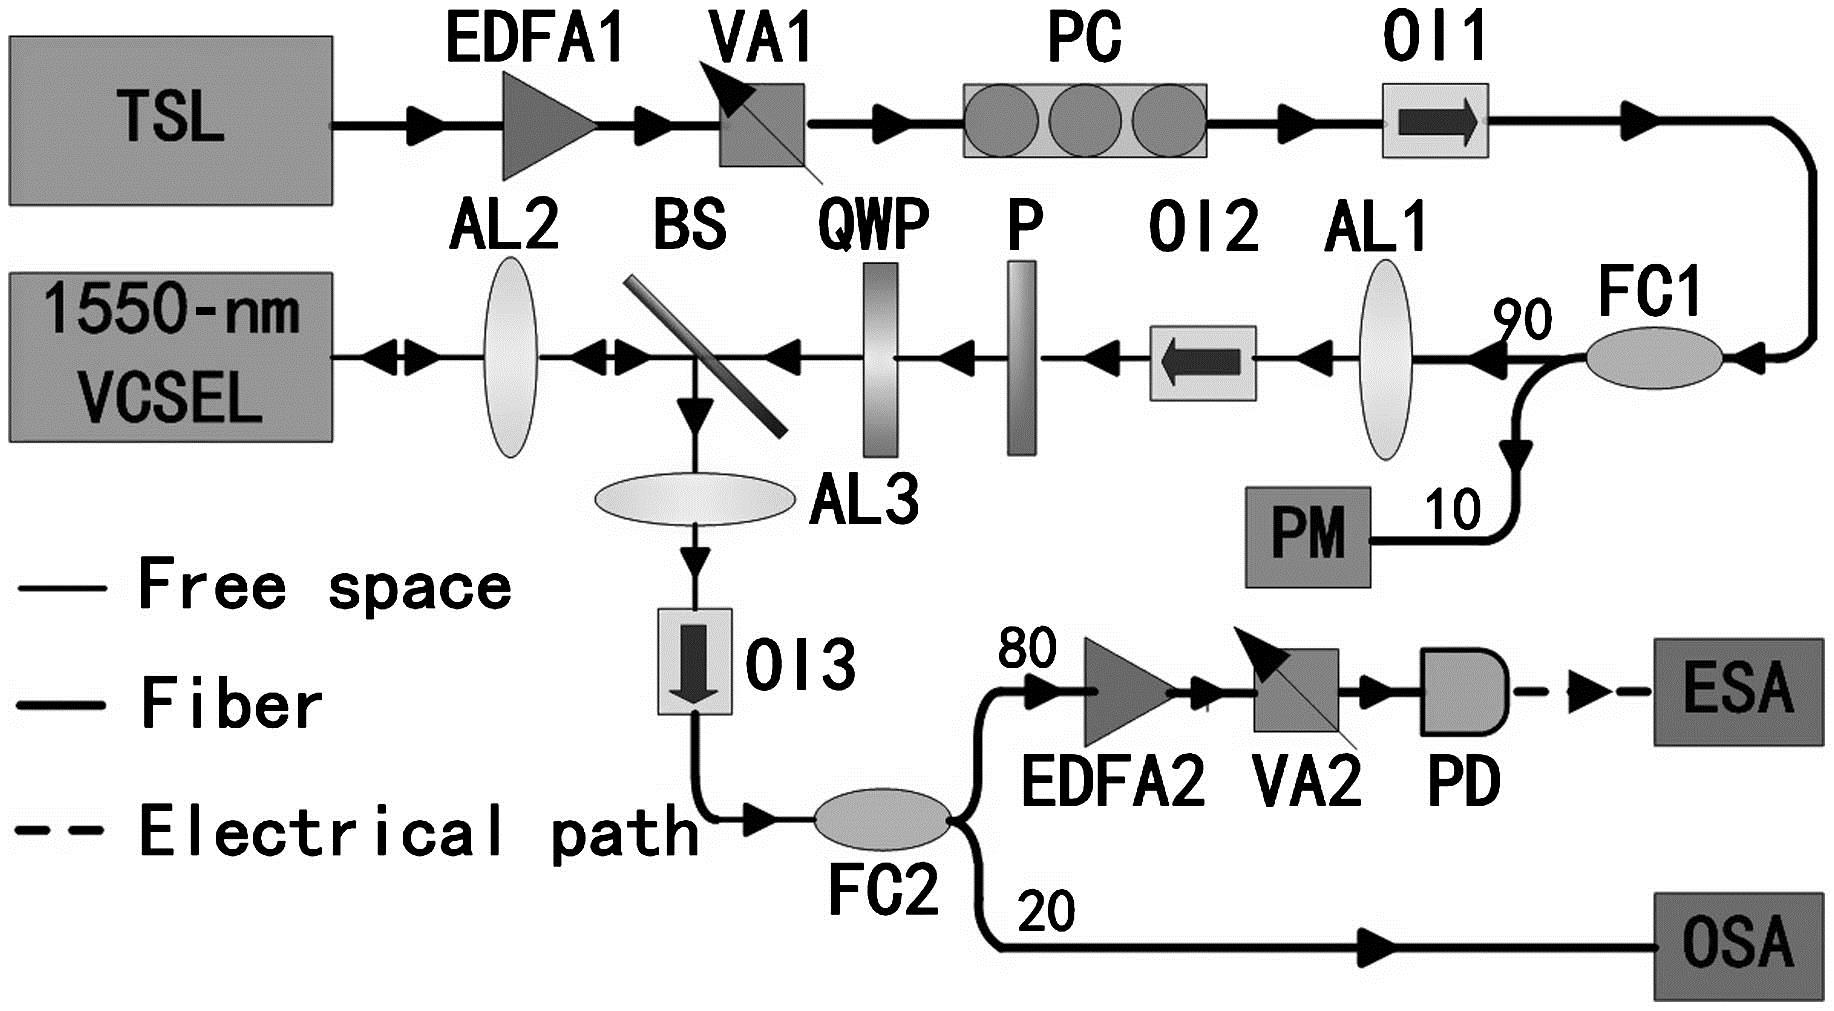
Fig. 1. Experimental setup. TSL: tunable semiconductor laser; 1550 nm VCSEL: EDFA: erbium-doped fiber amplifier.
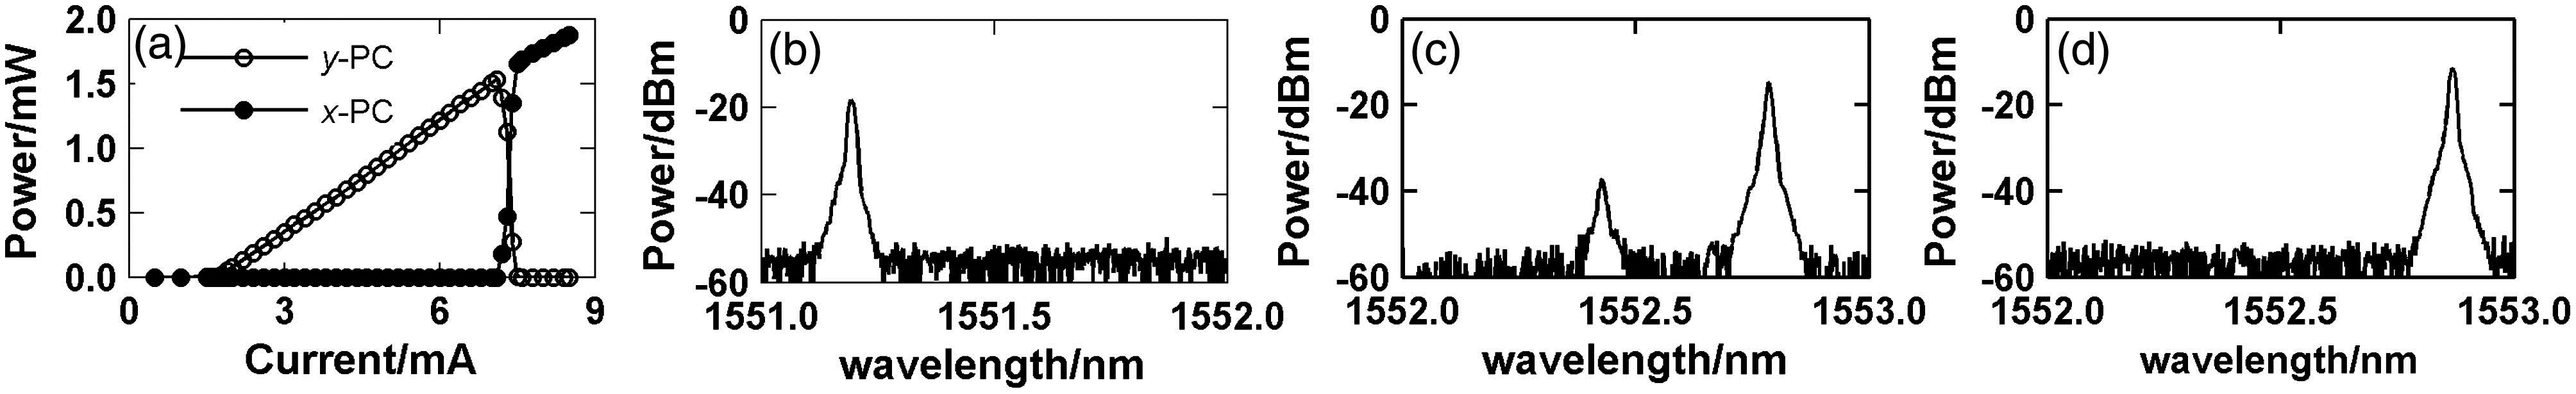
Fig. 2. (a) Polarization-resolved P – I
Fig. 3. Polarization-resolved power versus injected power P inj I = 4.00 mA Δ ν 1 = 5.65 GHz x - PC y - PC
Fig. 4. Optical spectra (left column) centered at ν x Δ ν 1 = 1.16 GHz
Fig. 5. Mapping of the dynamical behaviors of the 1550 nm VCSEL subject to CPOI in the parameter space of P inj Δ ν 1 I = 4.00 mA
Fig. 6. Polarization-resolved power versus injected power P inj I = 7.60 mA Δ ν 2 = 11.71 GHz y - PC x - PC
Fig. 7. Optical spectra (left column) centered at ν y Δ ν 2 = 3.25 GHz
Fig. 8. Mapping of the dynamical behaviors of the 1550 nm VCSEL subject to CPOI in the parameters space of P inj Δ ν 2 I = 7.60 mA

Set citation alerts for the article
Please enter your email address
© Copyright 2018-2021 | Chinese Laser Press. All Rights Reserved 沪ICP备15018463号-20