Author Affiliations
Institute of Nuclear Engineering, Rocket Force Engineering University, Xi'an, Shaanxi 710025, Chinashow less
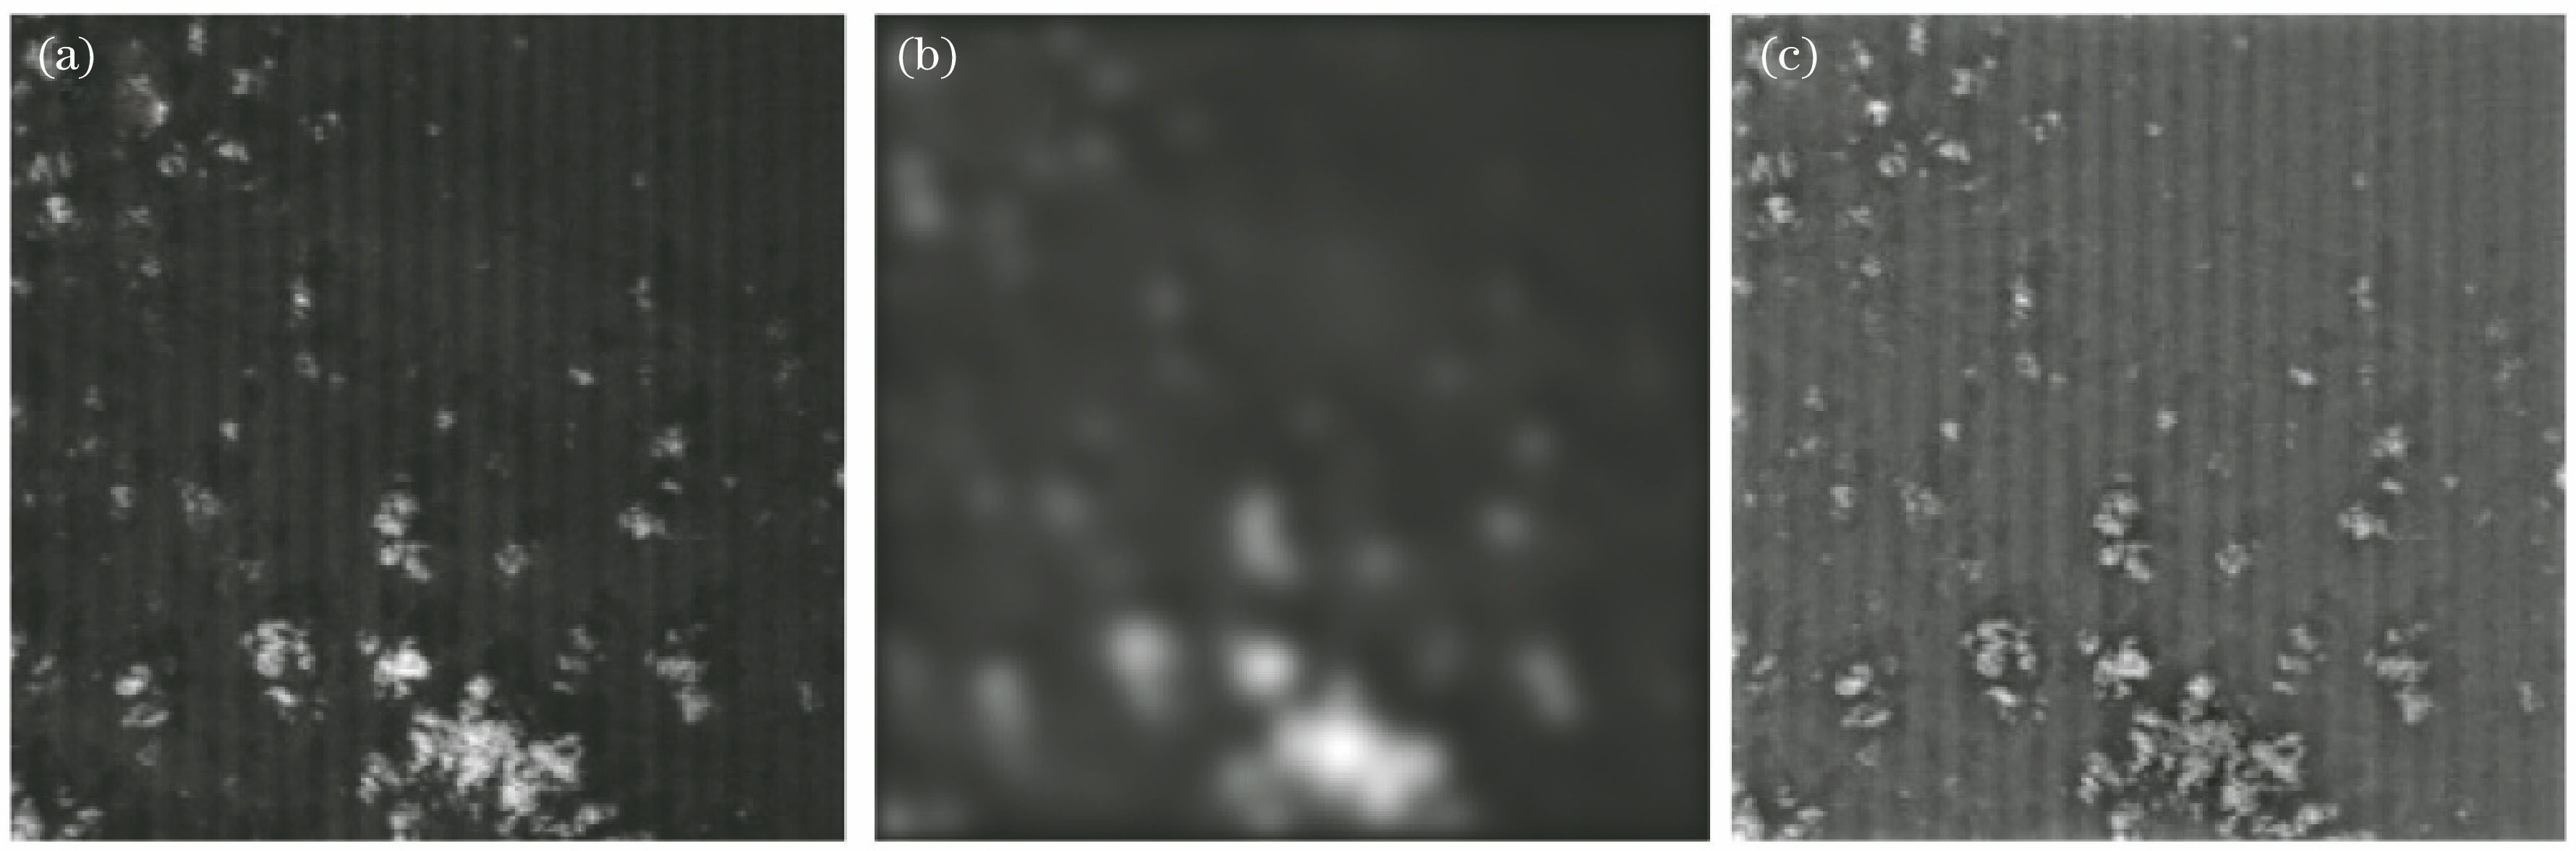
Fig. 1. Experimental results after 1000 Gaussian filtering. (a) Original strip noise image Y; (b) filtered image X; (c) residual image R
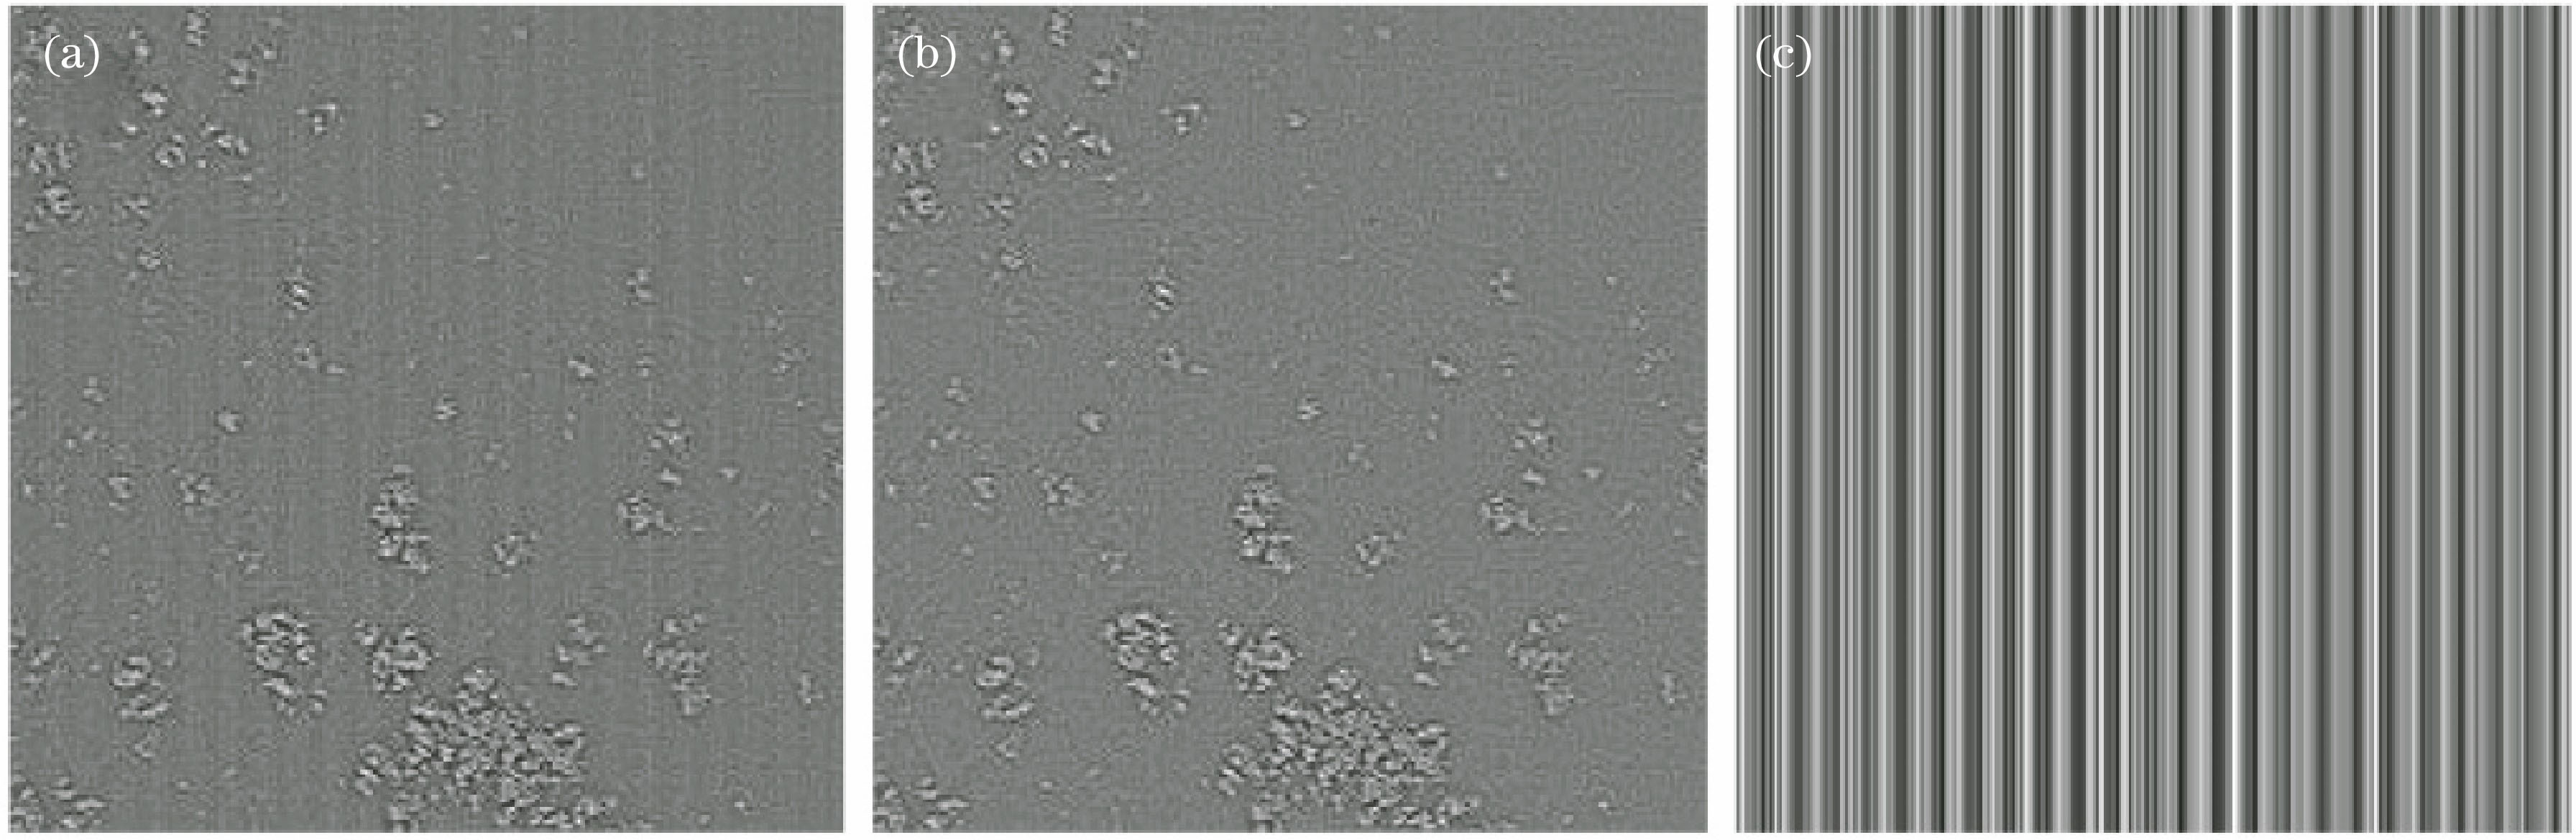
Fig. 2. Separation results of strip noise and detail. (a) Residual image R; (b) details D; (c) strip noise S
Fig. 3. Lenna images with strip noise of different degrees. (a) 0.01; (b) 0.02; (c) 0.05; (d) 0.1; (e) 0.2; (f) 0.5
Fig. 4. Test images. (a) Test image-1; (b) test image-2
Fig. 5. Stripe noise removing results of different algorithms on test image-1. (a) WFAF; (b) MDBC; (c) IDP; (d) RSLFRI
Fig. 6. Stripe noise removing results of different algorithms on test image-2. (a) WFAF; (b) MDBC; (c) IDP; (d) RSLFRI
Fig. 7. Comparison of mean column profiles before and after de-noising of test image-1
Fig. 8. Comparison of mean column profiles before and after de-noising of test image-2
Input: Y, K |
---|
Output: X | 1. Initialization: X=Y, β=En×1, ε=0.0001 | 2. While >ε | 3. R=X-K*X | 4. β=RTEm×1/m | 5. F=X-Em×1βT | 6. X=F-μFEm×n+μYEm×n | 7. End |
|
Table 1. Steps of RSLFRI algorithm
Image | Parameter | σ |
---|
0.25 | 0.27 | 0.3 | 0.32 | 0.33 | 0.35 | 0.4 | 0.5 | 1 | 10 |
---|
Lenna-1 | IRS | 8×10⁻⁷ | 8×10⁻⁶ | 0.5639 | 0.6930 | 2.3333 | 4.5913 | 14.3913 | 26.3392 | 41.7984 | 44.7957 | IIM | 0.0003 | 0.0003 | 0.0002 | 0.0002 | 0.0006 | 0.0014 | 0.0050 | 0.0094 | 0.0151 | 0.0162 | Lenna-2 | IRS | 7×10⁻⁷ | 0.0387 | 0.6214 | 0.9677 | 1.2007 | 1.8425 | 4.3673 | 7.3466 | 10.9396 | 11.6647 | IIM | 0.0014 | 0.0010 | 0.0005 | 0.0006 | 0.0008 | 0.0016 | 0.0051 | 0.0093 | 0.0144 | 0.0154 | Lenna-3 | IRS | 0.0245 | 0.3620 | 0.7204 | 0.8909 | 0.9608 | 1.0843 | 1.5794 | 2.1763 | 2.9538 | 3.0911 | IIM | 0.0065 | 0.0027 | 0.0015 | 0.0013 | 0.0014 | 0.0018 | 0.0048 | 0.0094 | 0.0157 | 0.0168 | Lenna-4 | IRS | 0.2235 | 0.4811 | 0.7024 | 0.8261 | 0.8646 | 0.9551 | 1.1540 | 1.3170 | 1.5199 | 1.5562 | IIM | 0.0162 | 0.0101 | 0.0057 | 0.0037 | 0.0033 | 0.0030 | 0.0057 | 0.0101 | 0.0162 | 0.0173 | Lenna-5 | IRS | 0.4640 | 0.6704 | 0.8168 | 0.8679 | 0.8830 | 0.9232 | 0.9835 | 1.0690 | 1.1410 | 1.1522 | IIM | 0.0373 | 0.0242 | 0.0157 | 0.0131 | 0.0123 | 0.0110 | 0.0116 | 0.0186 | 0.0282 | 0.0300 | Lenna-6 | IRS | 0.6227 | 0.7843 | 0.8780 | 0.9096 | 0.9219 | 0.9427 | 0.9904 | 1.0411 | 1.0974 | 1.1099 | IIM | 0.1394 | 0.0932 | 0.0693 | 0.0638 | 0.0623 | 0.0616 | 0.0751 | 0.1086 | 0.1454 | 0.1521 |
|
Table 2. Influences of filter standard deviation σ on the performance of RSLFRI algorithm
Image | Parameter | Initial image | WFAF | MDBC | IDP | RSLFRI |
---|
Test image-1 | μ | 0.4512 | 0.4512 | 0.4512 | 0.4512 | 0.4512 | δ | 0.0133 | 0.0111 | 0.0101 | 0.0098 | 0.0112 | fPSNR | 20.9514 | 22.0721 | 21.8917 | 22.0234 | 22.1907 | H | 6.8857 | 6.7179 | 6.6264 | 6.6159 | 6.7231 | | 1.0000 | 0.9827 | 0.9706 | 0.9777 | 0.9831 | | 0 | 0.0050 | 0.0054 | 0.0060 | 0.0048 | Test image-2 | μ | 0.2176 | 0.2176 | 0.2176 | 0.2176 | 0.2176 | δ | 0.0090 | 0.0090 | 0.0083 | 0.0081 | 0.0090 | fPSNR | 19.5468 | 19.5482 | 19.2601 | 19.3885 | 19.5560 | H | 5.9748 | 5.9577 | 6.1546 | 5.8446 | 5.9477 | | 1.0000 | 0.9956 | 0.9906 | 0.9772 | 0.9970 | | 0 | 0.0002 | 0.0008 | 0.0006 | 0.0001 |
|
Table 3. Comparison of ability to maintain information for different algorithms