
Yongxing Guo, Min Chen, Li Xiong, Xinglin Zhou, Cong Li. Integrated Fiber Grating Three-Dimensional Acceleration Sensor[J]. Laser & Optoelectronics Progress, 2021, 58(21): 2106007
- Laser & Optoelectronics Progress
- Vol. 58, Issue 21, 2106007 (2021)
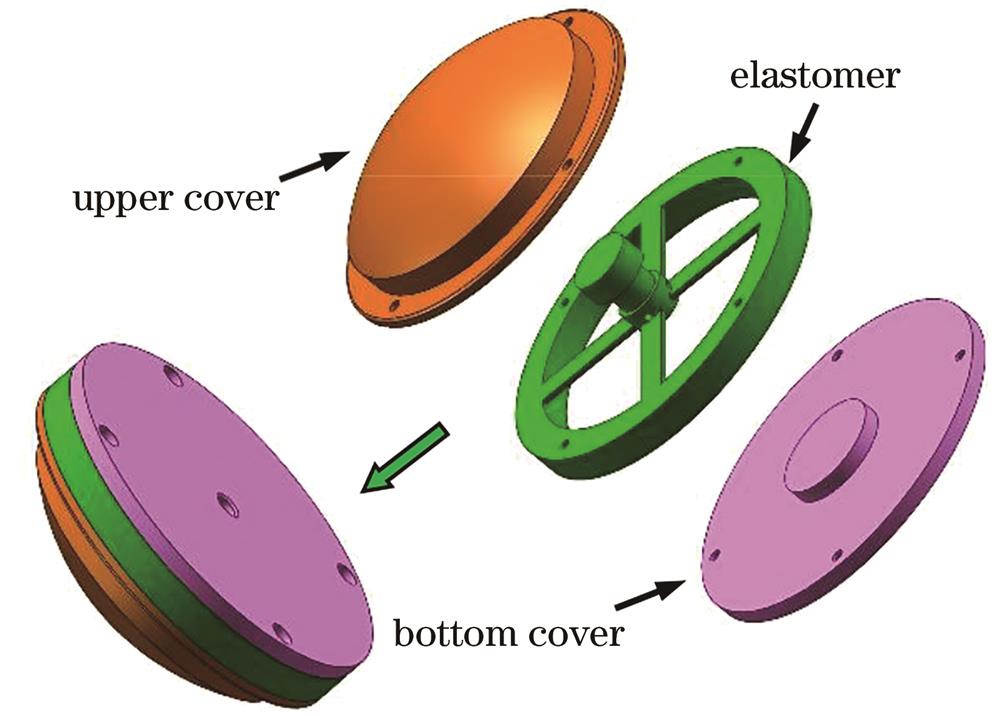
Fig. 1. Schematic diagram of three-dimensional FBG acceleration sensor
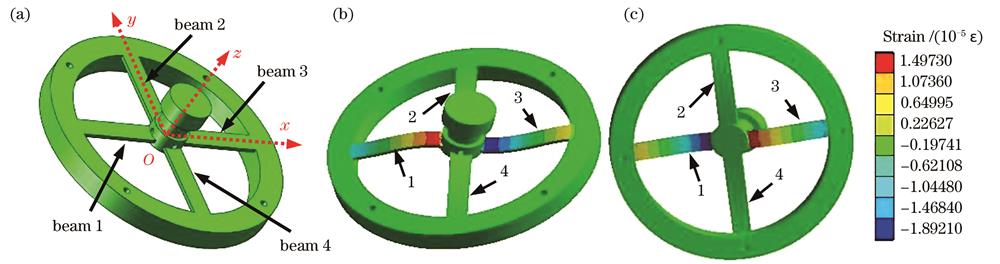
Fig. 2. Simulation analysis of elastomer under force Fx. (a) Three-dimensional simplified model; (b) strain distributions of upper surfaces of beams; (c) strain distributions of lower surfaces of beams
Fig. 3. Simulation analysis of specific paths under force Fx. (a) Center lines of beam surfaces;(b)relationship between strain and distance on five paths
Fig. 4. Relationship between strain and distance on five paths under force Fz
Fig. 5. Layout of FBGs on elastomer
Fig. 6. Vibration test and signal acquisition system. (a) Structural diagram; (b) physical prototype
Fig. 7. Amplitude-frequency characteristic curves of sensor in x and y directions.(a)x-direction;(b)y-direction
Fig. 8. Amplitude-frequency characteristic curve of sensor in z-direction
Fig. 9. Test results of sensor under excitations in x and y directions. (a) Results of three tests (excitation along x-direction); (b) average values of three tests (excitation along x-direction); (c) linear fitting curve of x-axis (x-direction); (d) results of three tests (excitation along y-direction); (e) average values of three tests (excitation along y-direction); (f) linear fitting curve of y-axis (y-direction)
Fig. 10. Test results of sensor under z-direction excitation. (a) Results of three tests; (b) average values of three tests; (c) linear fitting curve of z-axis
Fig. 11. Transverse interference test results of sensor under excitations in x and y directions at different frequencies. (a) x-direction excitation; (b) y-direction excitation
Fig. 12. Transverse interference test results of sensor under z direction excitation at different frequencies
Fig. 13. Test system for temperature-compensation performance of sensor
Fig. 14. Test results of temperature-compensation performance of sensor

Set citation alerts for the article
Please enter your email address
© Copyright 2018-2021 | Chinese Laser Press. All Rights Reserved 沪ICP备15018463号-20