
Xudong DU, Chengyuan TANG, Xiaoli YANG, Jianbo CHENG, Yuke JIA, Shubin YANG. High-efficiency Biogenic Calcium Carbonate for Adsorption of Pb(II) and Methyl Orange from Wastewater [J]. Journal of Inorganic Materials, 2020, 35(3): 315
- Journal of Inorganic Materials
- Vol. 35, Issue 3, 315 (2020)
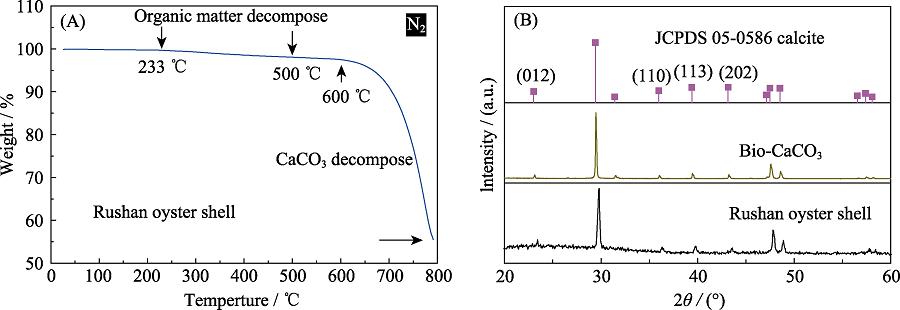
1. TGA curve of oyster shell (A) and XRD patterns of oyster shell before and after calcination (B)

2. Effect of adsorption time on the sorption of Pb(II) (A) and MO (B) by bio-CaCO3
3. Pseudo-first-order (A), pseudo-second-order (B), and Intraparticle diffusion model (C) fitting for Pb(II) sorption by bio-CaCO3
4. Effects of pH (A) and ionic strength (B) on Pb(II) sorption by bio-CaCO3
5. Adsorption isothermals of Pb(II) on bio-CaCO3
6. Plots of distribution coefficient against temperature for Pb(II) adsorption with different concentrations by bio-CaCO3
7. XRD patterns of bio-CaCO3 after Pb(II) sorption (A) and structure image of cerussite (B)
8. SEM images of bio-CaCO3 before (A) and after Pb(II) sorption (B, C)
9. MO removal percentage of bio-CaCO3 and activated carbon
10. SEM images of bio-CaCO3 before (A) and after (B) MO sorption
|
Table 1. XRF results of oyster shell
|
Table 2. Physical property of oyster and calcined oyster
| ||||||||||||||||||
Table 3. Kinetic parameters of Pb(II) sorption by bio-CaCO3
|
Table 4. Intraparticle diffusion model constants and correlation coefficient for Pb(II) sorption by bio-CaCO3
| ||||||||||||||||||||||||||||||||||
Table 5. Parameters of Pb(II) sorption by bio-CaCO3 for Langmuir and Freundlich constants models
| |||||||||||||||||||||||||||||||||||||||||||||||||||||||||
Table 6. Thermodynamic parameters for the adsorption of Pb(II) on bio-CaCO3
|
Table 7. Comparison of Pb(II) adsorption capacity of Bio-CaCO3 with other adsorbents


Set citation alerts for the article
Please enter your email address

© Copyright 2018-2021 | Chinese Laser Press. All Rights Reserved 沪ICP备15018463号-20