
Hongqiu Zhu, Shujun Wu, Yonggang Li, Chunhua Yang. A Spectrophotometric Detecting Method of Trace Copper Ion in Zinc Solution Based on Partition Modeling[J]. Acta Optica Sinica, 2019, 39(2): 0230002
- Acta Optica Sinica
- Vol. 39, Issue 2, 0230002 (2019)
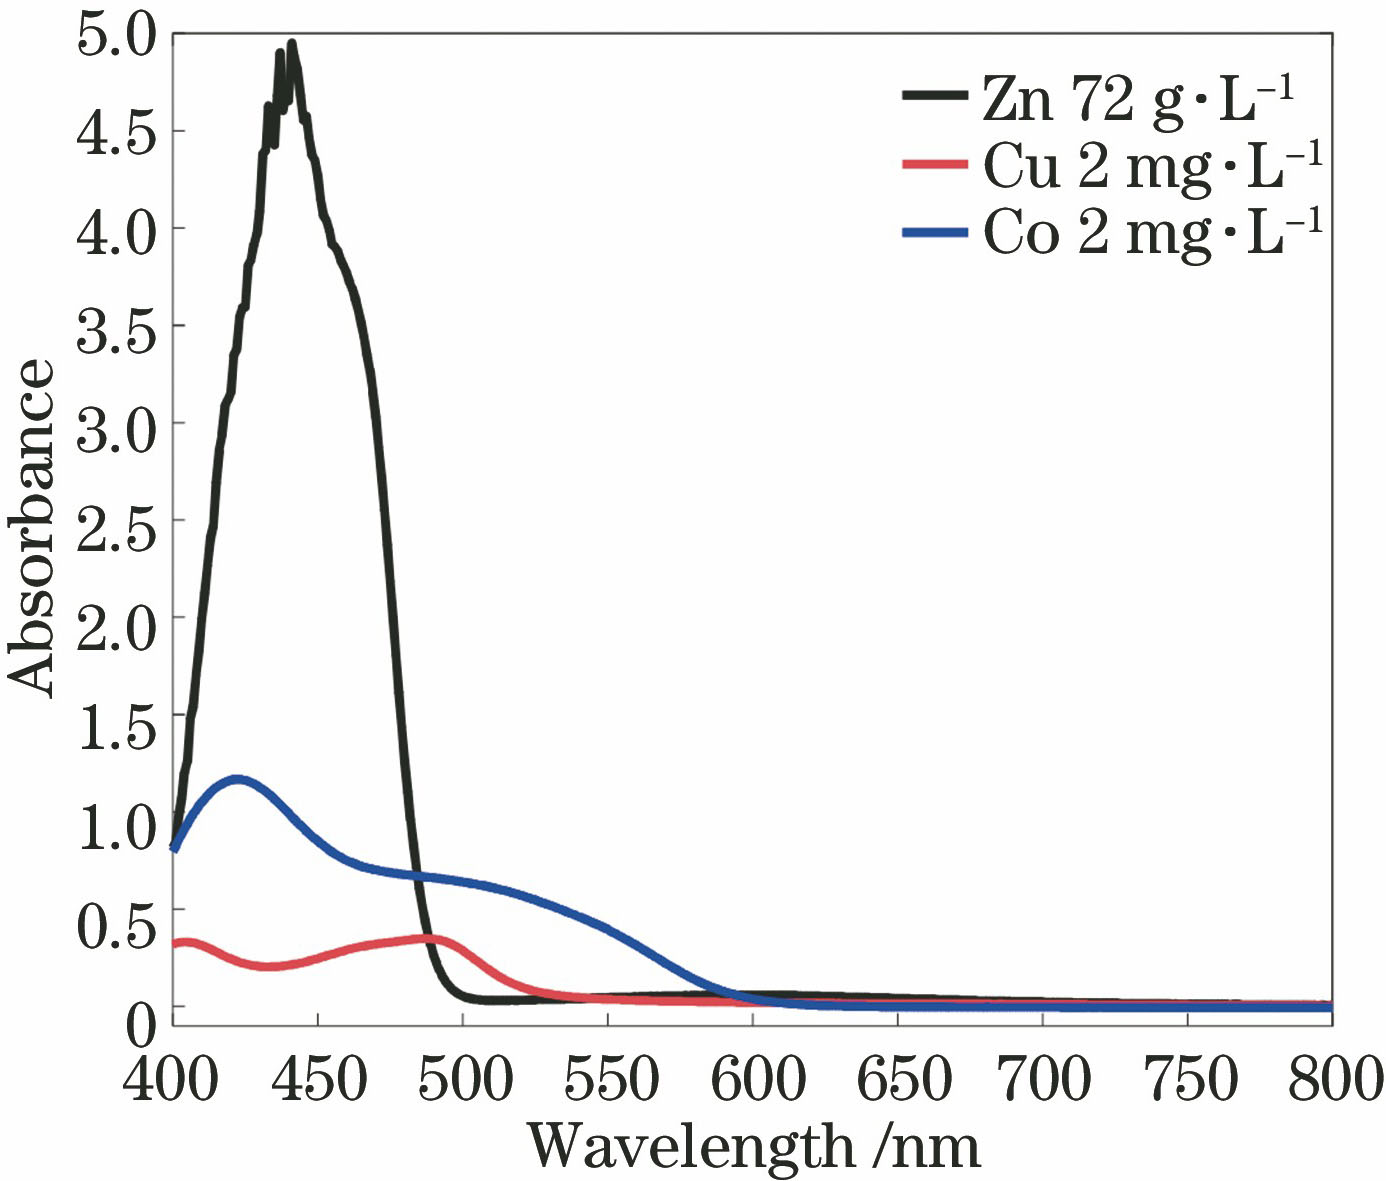
Fig. 1. Original spectral signals of Zn(II),Cu(II),Co(II)
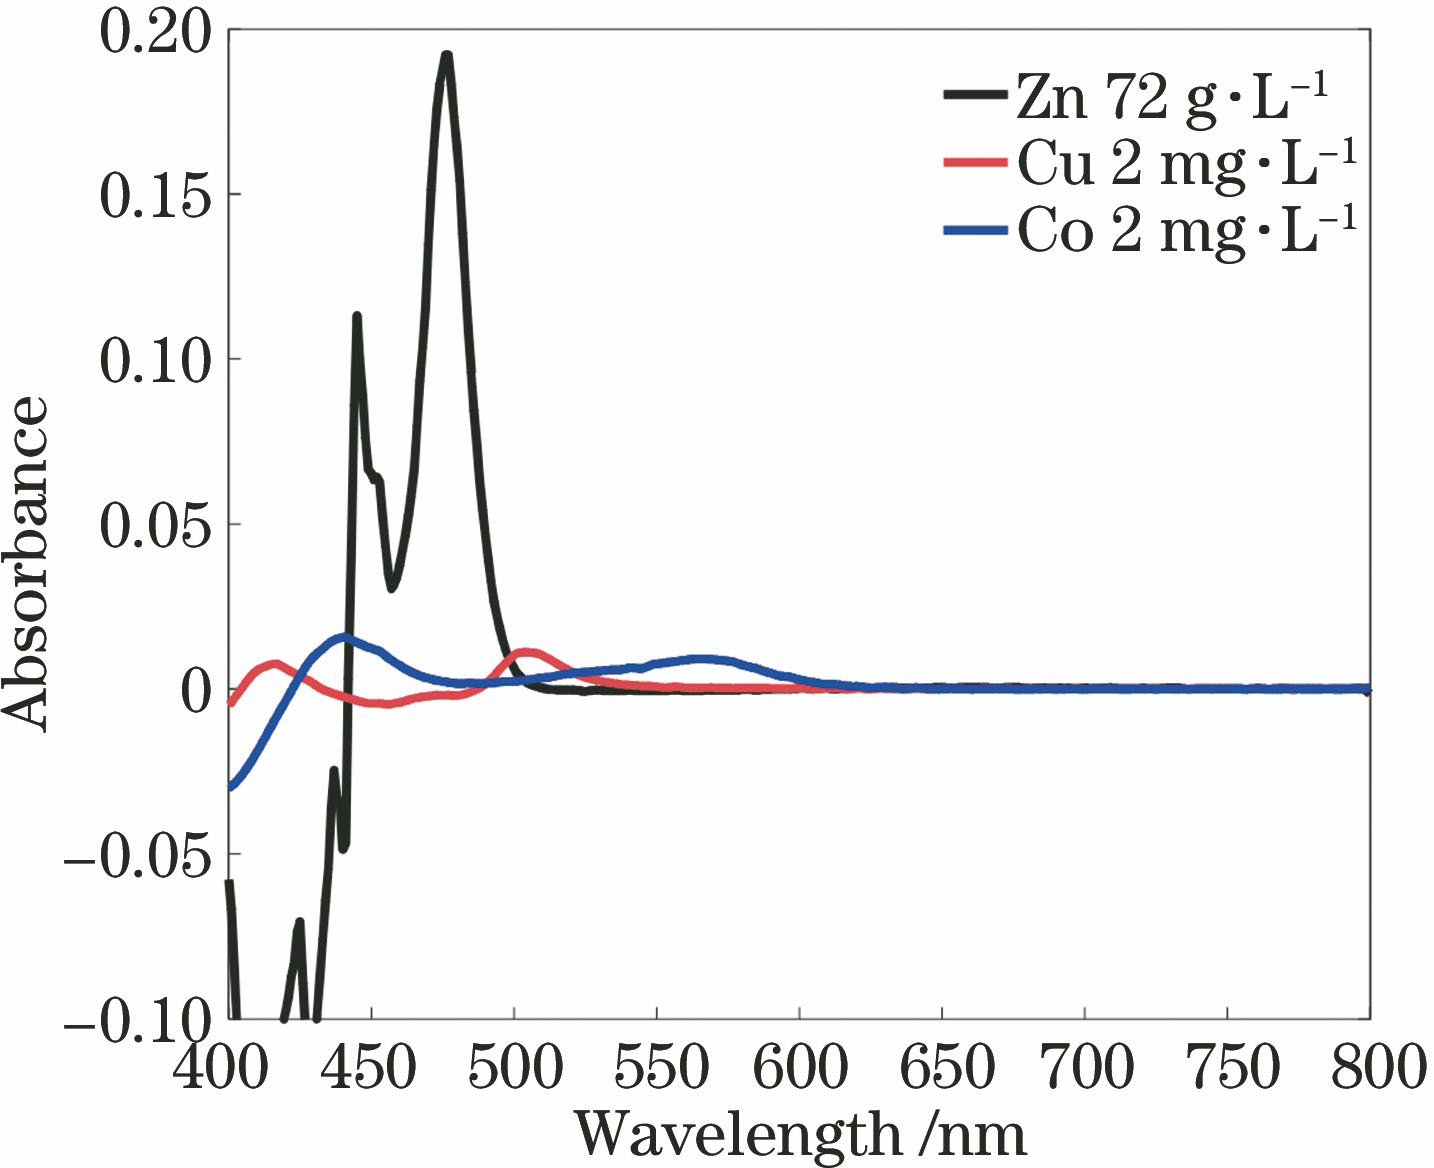
Fig. 2. Derivative denoising spectral signals of Zn(II), Cu(II), Co(II)
Fig. 3. (a) Spectral signals of different mass concentrations of Cu(II) in the background of high mass concentration of Zn(II)and trace concentration of Co(II); (b) relationship between Cu(II) mass concentration and spectral signal at 9 wavelength points
Fig. 4. Correlation coefficient-stability value of wavelength variables of trace Cu(II)
Fig. 5. Stability value of wavelength variables with MC-UVE PLS method
Fig. 6. CVmse of models with different number of wavelength variables
Fig. 7. Scatter plots of predicted and measured mass concentrations of Cu(II)
|
Table 1. Fitting functions of Cu(II) mass concentration c and spectral signal at different wavelengths
|
Table 2. Parameters of SVM model
| ||||||||||||||
Table 3. Confusion matrix of mass concentration interval prediction results for Cu(II)
|
Table 4. Modeling results based on seven methods

Set citation alerts for the article
Please enter your email address
© Copyright 2018-2021 | Chinese Laser Press. All Rights Reserved 沪ICP备15018463号-20