
Zhang Xi, Li Pingxue, Dong Xueyan, Yang Weixin. Parameter Design and Thermal Effect Numerical Simulation of 10 kW Fiber Connector[J]. Laser & Optoelectronics Progress, 2021, 58(1): 114009
- Laser & Optoelectronics Progress
- Vol. 58, Issue 1, 114009 (2021)
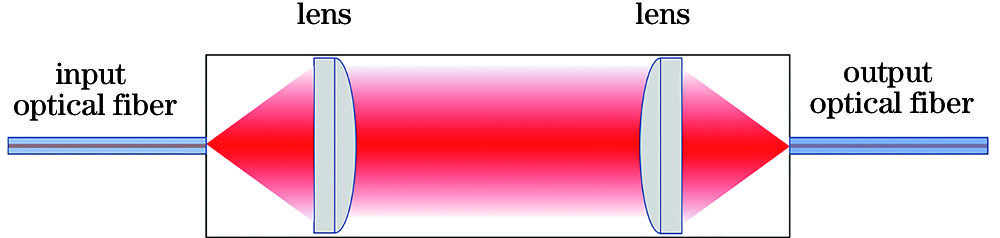
Fig. 1. Structure of expanding fiber connector
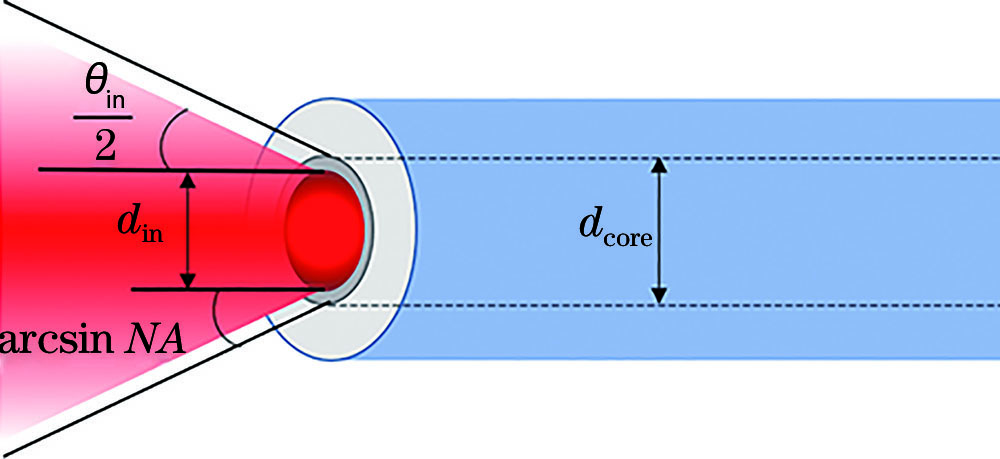
Fig. 2. Beam coupling diagram
Fig. 3. Structure diagram of edge water cooling
Fig. 4. Air cooling structure of planar heat dissipation
Fig. 5. Air cooling structure of side heat dissipation
Fig. 6. Maximum temperature of lens surface varies with lens thickness
Fig. 7. Simulation results of lens surface temperature under different cooling modes when thickness changes. (a)(c)(e) Lens edge thickness is 5 mm; (b)(d)(f) lens edge thickness is 25 mm
Fig. 8. Maximum temperature of lens surface varies with lens diameter
Fig. 9. Maximum temperature of lens surface varies with wind speed
Fig. 10. Simulation results of temperature distribution on lens surface when wind speed changes. (a)(c)Wind speed is 1 m/s; (b)(d) wind speed is 19 m/s
Fig. 11. Maximum temperature of lens surface varies with temperature
Fig. 12. Aspheric pressure distribution of side air-cooled lens
Fig. 13. Planar pressure distribution of planar air-cooled lens
Fig. 14. Experimental schematic
Fig. 15. Surface temperature diagram of fused quartz glass. (a) Power is 10 W;(b) power is 70 W
Fig. 16. Comparison of experimental and simulated data

Set citation alerts for the article
Please enter your email address
© Copyright 2018-2021 | Chinese Laser Press. All Rights Reserved 沪ICP备15018463号-20