
Chunlei Liu, Hongli Zhang, Cong Wang. UAV Bridge Laser Scanning Path Planning Based on Coverage Path Arcs[J]. Laser & Optoelectronics Progress, 2021, 58(8): 0828003
- Laser & Optoelectronics Progress
- Vol. 58, Issue 8, 0828003 (2021)
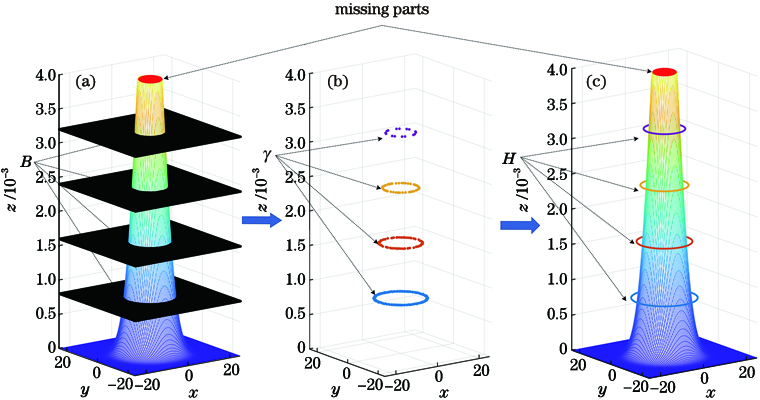
Fig. 1. Modeling and defects of point cloud slice model. (a) Slicing; (b) intersection; (c) clustering and convex hull
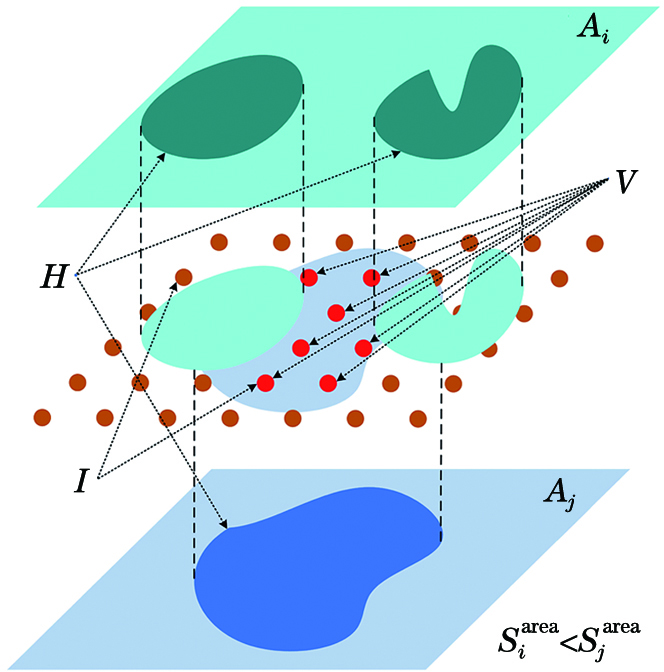
Fig. 2. Screening of additional view points
Fig. 3. Viewpoint transformation arc set
Fig. 4. Splitting of arc
Fig. 5. Modeling results of covering path arc model. (a) Point cloud slice modeling; (b) adding supplementary arc
Fig. 6. Unit decomposition model modeling results. (a) Viewpoint; (b) Viewpoint pathway
Fig. 7. Task assignment results. (a) N=3; (b) N=4; (c) N=5; (d) N=6
Fig. 8. Comparison of allocation uniformity. (a) Task set with high uniformity; (b) task set with low uniformity
Fig. 9. CRSOM planning results. (a) att48; (b) eil101; (c) ch150; (d) d198; (e) rand200; (f) gil262; (g) a280; (h) lin318; (i) pcb442
Fig. 10. Planning path results. (a) N=3; (b) N=4; (c) N=5; (d) N=6
Fig. 11. Relationship between number of agents and task completion time of system
| ||||||||||||||||||||||||||||||||||
Table 1. Statistical table of modeling comparison experiment
| ||||||||||||||||||||||||||||||||||||||||||||||||||||||||||||||||||||||||||||||||||||||||||||||||||
Table 2. Experimental results of CRSOM Monte Carlo

Set citation alerts for the article
Please enter your email address
© Copyright 2018-2021 | Chinese Laser Press. All Rights Reserved 沪ICP备15018463号-20