
Qunli Zhang, Hua Huang, Zehao Tang, Guochang Li, Qing’an Niu, Zhijun Chen, Yangqiong Du, Jianhua Yao. Rolling Wear and Fatigue Damage Behavior of Laser-Induction Hybrid Quenching on 42CrMo Steel[J]. Chinese Journal of Lasers, 2022, 49(8): 0802023
- Chinese Journal of Lasers
- Vol. 49, Issue 8, 0802023 (2022)
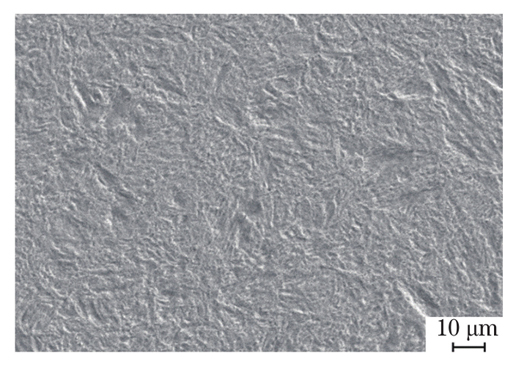
Fig. 1. Microstructure of 42CrMo steel matrix
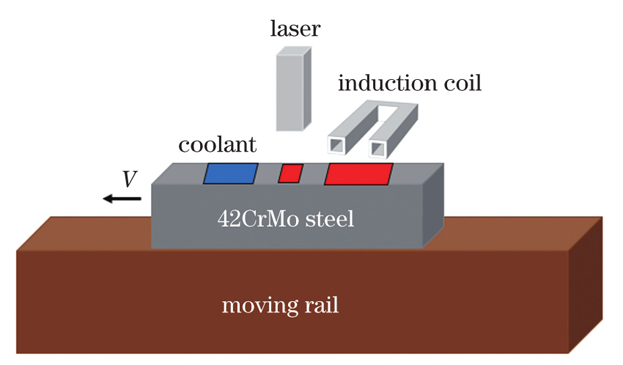
Fig. 2. Schematic of laser-induction hybrid quenching on 42CrMo steel
Fig. 3. Microhardness curves of laser-induction hybrid quenching hardened layers
Fig. 4. Physical model and locations of feature points
Fig. 5. Schematic of rolling wear test device
Fig. 6. Microstructure of laser-induction hybrid quenching hardened layer
Fig. 7. Residual stress distributions of hardened layer samples with different depths. (a) Residual stress distribution of 3.5 mm depth specimen along X direction; (b) residual stress distribution of 3.5 mm depth specimen along Y direction; (c) residual stress distribution of 4.5 mm depth specimen along X direction; (d) residual stress distribution of 4.5 mm depth specimen along Y direction; (e) residual stress distribution of 6.3 mm depth specimen along X direction; (f) residual stress distribution of 6.3 mm depth specimen along Y direction
Fig. 8. Surface damage morphologies of fatigue specimens with different depths of hardened layers. (a) Specimen with 3.5 mm depth; (b) specimen with 4.5 mm depth; (c) specimen with 6.3 mm depth
Fig. 9. Three-dimensional morphologies and two-dimensional profiles of cross-section for fatigue specimens with different depths of hardened layers. (a) Specimen with 3.5 mm depth; (b) specimen with 4.5 mm depth; (c) specimen with 6.3 mm depth
Fig. 10. Sectional crack morphology of fatigue specimen with hardened layer depth of 3.5 mm
Fig. 11. Sectional crack morphology of fatigue specimen with hardened layer depth of 4.5 mm
Fig. 12. Sectional crack morphology of fatigue specimen with hardened layer depth of 6.3 mm
Fig. 13. Schematic of surface cracking under heavy load condition
Fig. 14. Schematic of internal cracking under heavy load condition
|
Table 1. Chemical composition of 42CrMo steel
|
Table 2. Element distribution in area A in Fig. 12

Set citation alerts for the article
Please enter your email address
© Copyright 2018-2021 | Chinese Laser Press. All Rights Reserved 沪ICP备15018463号-20