Author Affiliations
1Aerospace Information Research Institute, Key Laboratory of Quantitative Remote Sensing Information Technology, Chinese Academy of Sciences, Beijing 100094, China2University of Chinese Academy of Sciences, Beijing 100049, Chinashow less
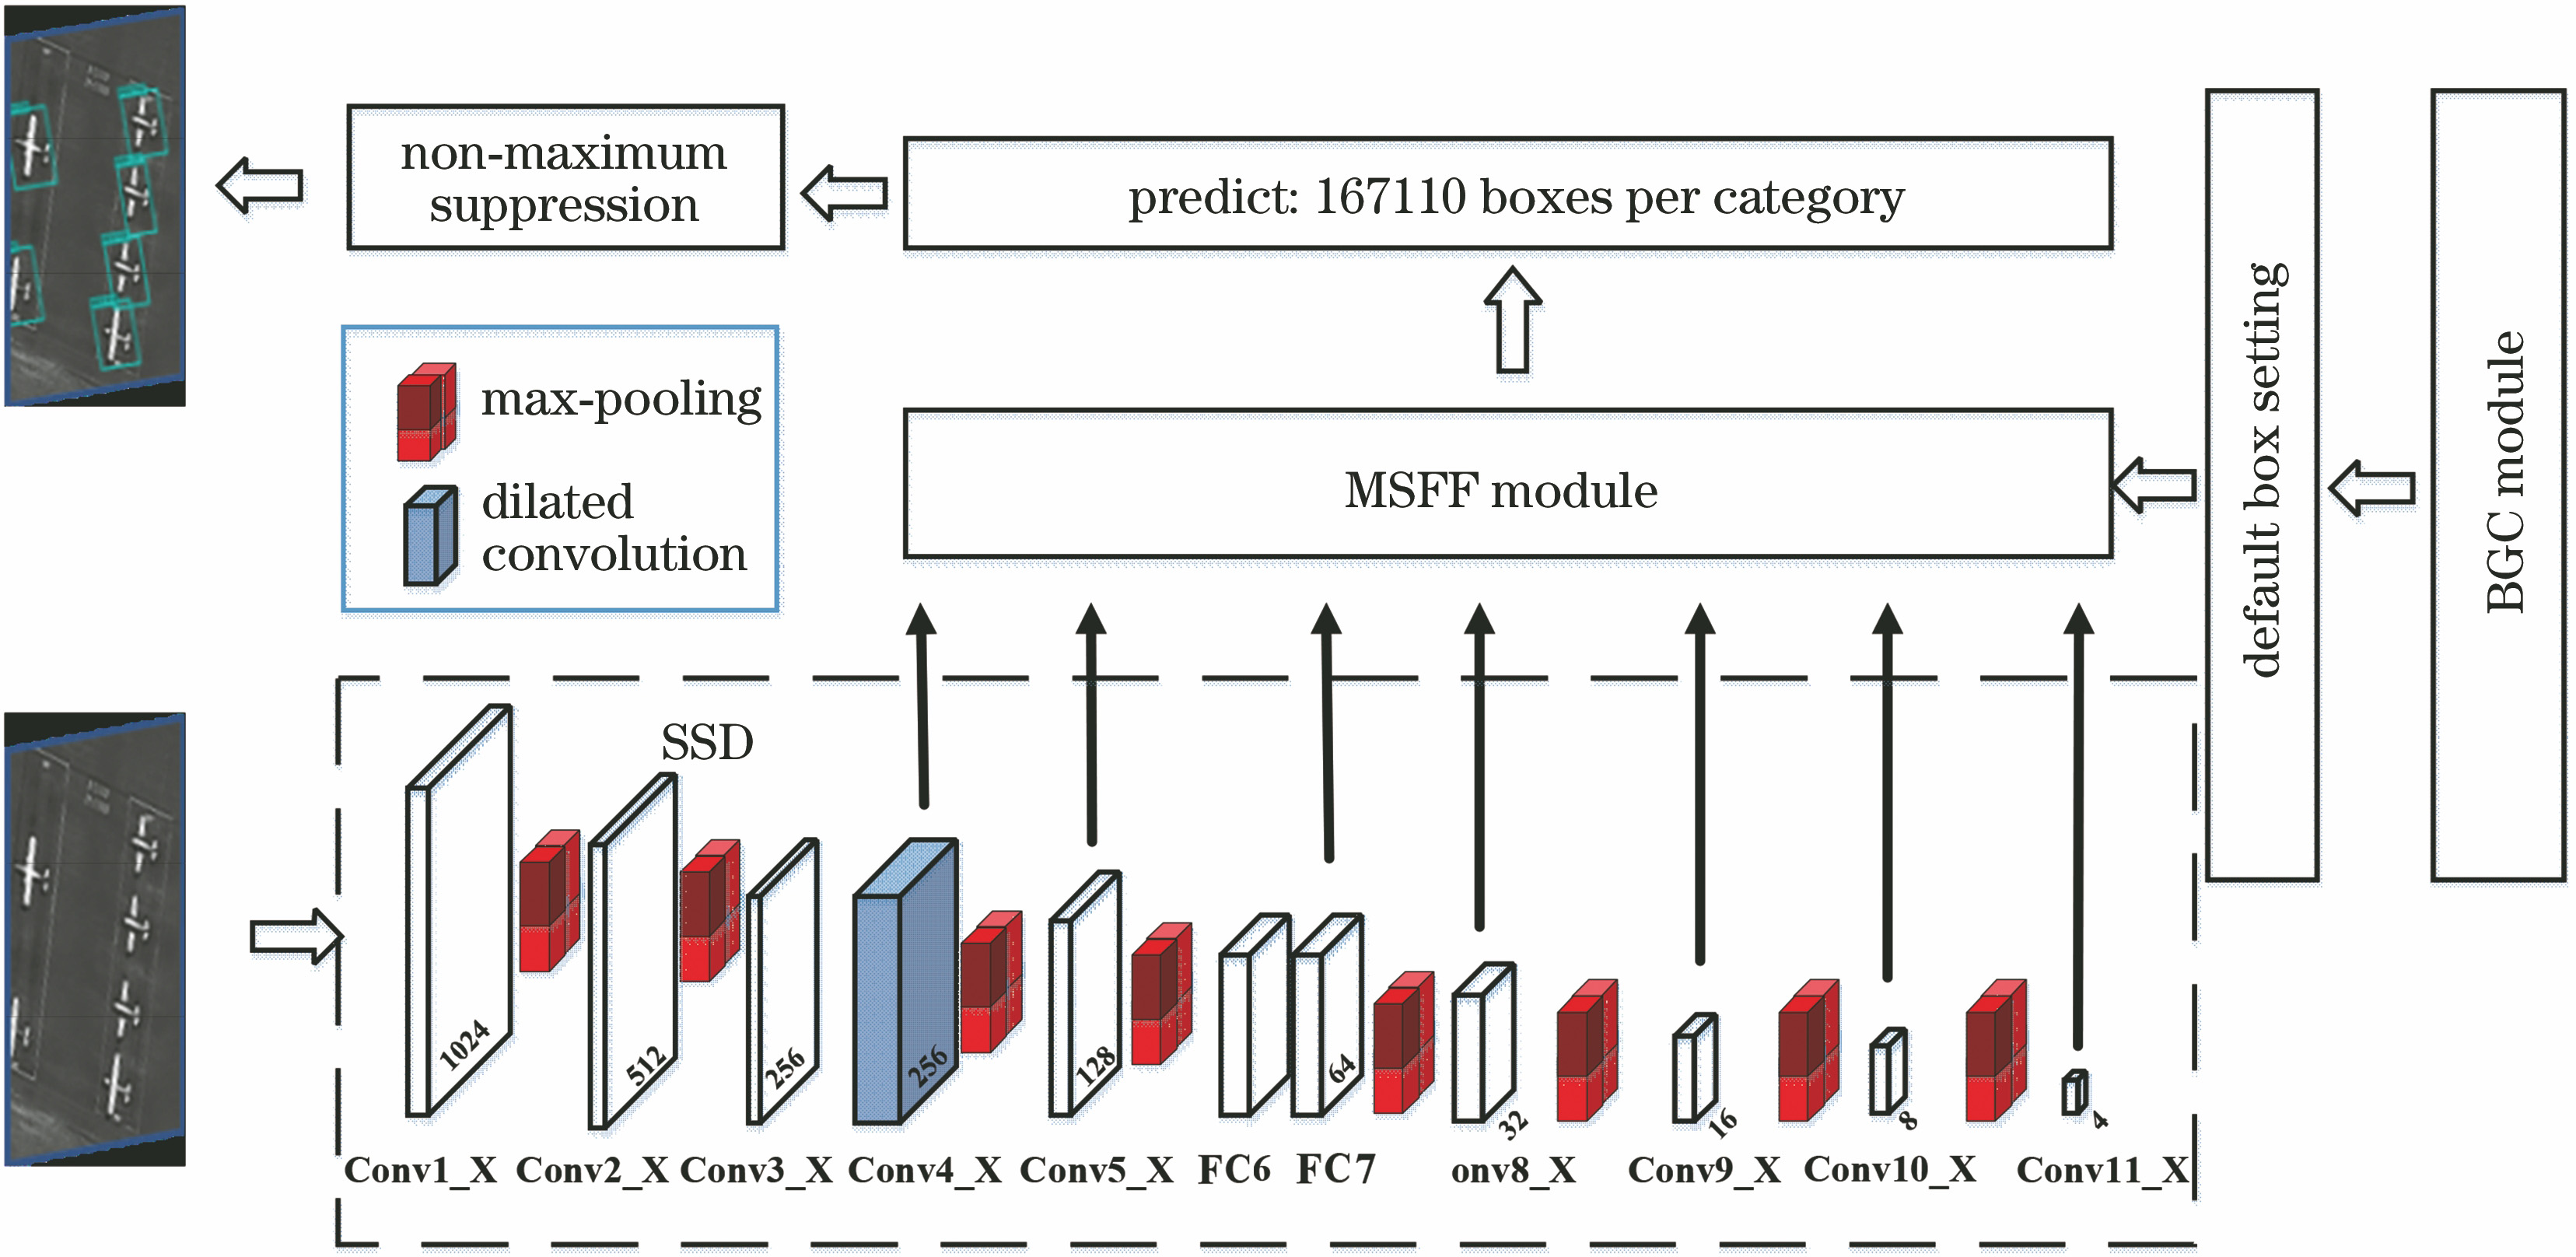
Fig. 1. Framework of FFC-SSD model
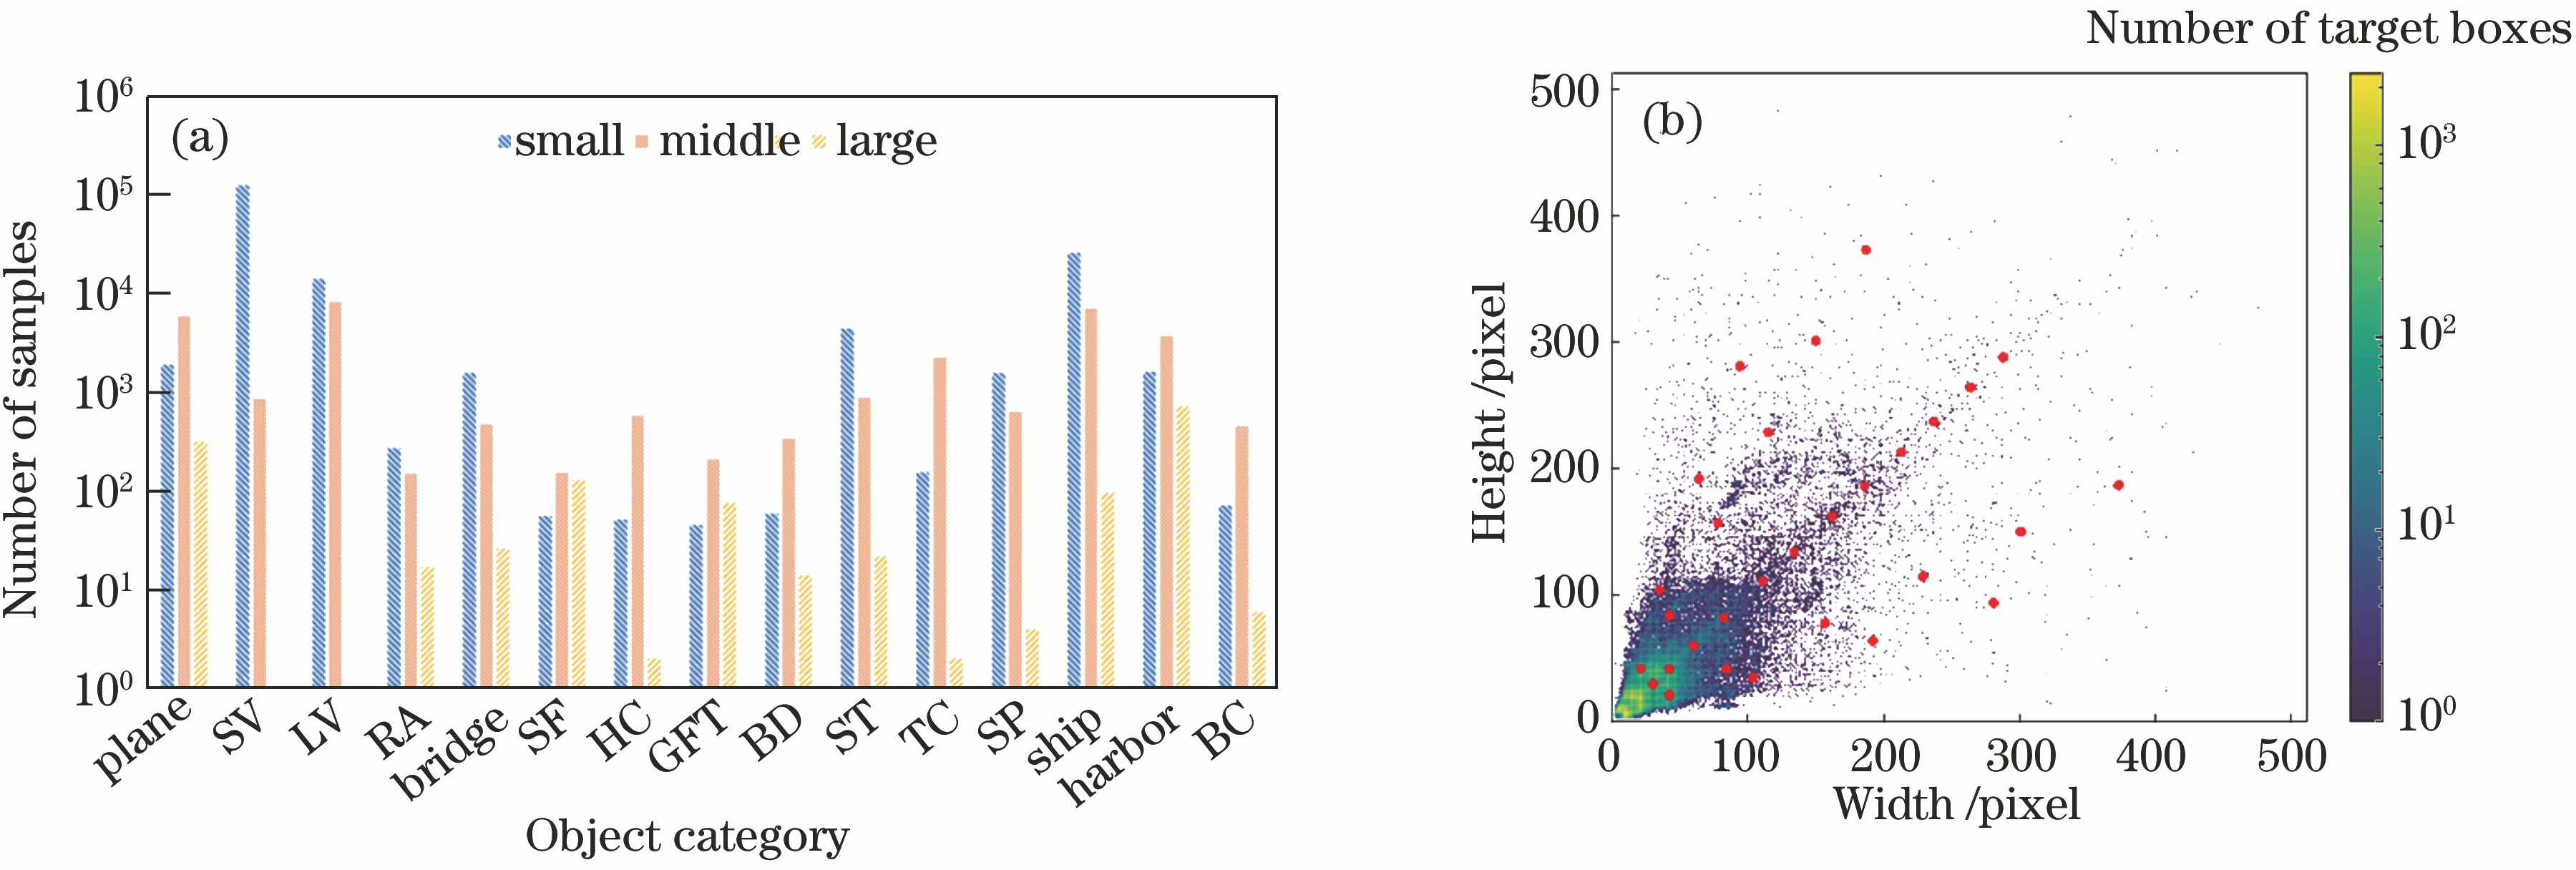
Fig. 2. Number of samples and size distribution of each category in DOTA dataset. (a) Number of samples; (b) size distribution
Fig. 3. Average coverage of five groups varying with number of clusters k
Fig. 4. Distribution of sample target box dimensions in DOTA and default target box dimensions set by group clustering
Fig. 5. Diagram of MSFF module
Fig. 6. Output feature maps of MSFF_D and MSFF_U modules. (a) Original images; (b) output feature maps of MSFF_D module; (c) output feature maps of MSFF_U module
Fig. 7. Convergence curves of loss function
Fig. 8. Average precision (AP) for each category in DOTA testing dataset for each experiment
Fig. 9. Test results of SSD and FFC-SSD models. (a)(c) SSD; (b)(d) FFC-SSD
| Group | Object category | Sample number per category |
|---|
| T0 | Small vehicle (SV) | >100000 | | T1 | Large vehicle (LV), ship | 20000~40000 | | T2 | Plane, storage tank (ST), harbor | 5000~10000 | | T3 | Bridge, tennis court (TC), swimming pool (SP) | 2000~5000 | | T4 | Roundabout (RA), soccer field(SF), ground field track (GFT), Baseball diamond (BD), basketball court (BC), helicopter (HC) | <2000 |
|
Table 1. Grouping description of target categories in DOTA datasets
| n | Layer | Feature map size /(pixel×pixel) | Size of default box w×h /(pixel×pixel) |
|---|
| 1 | Conv4_3 | 256×256 | 5×10,10×6,12×21,20×11,14×13,22×20,18×27,36×17 | | 2 | Conv5_3 | 128×128 | 27×39,75×45,48×29,42×69,40×39,84×23,24×66 | | 3 | FC7 | 64×64 | 72×80,92×89,56×72,48×91,105×60,73×100 | | 4 | Conv8_2 | 32×32 | 149×96,159×152,40×133,130×120 | | 5 | Conv9_2 | 16×16 | 167×201,97×187,59×210 | | 6 | Conv10_2 | 8×8 | 246×248 | | 7 | Conv11_2 | 4×4 | 290×323 |
|
Table 2. Default target box size on each fusion feature map
| Object category | SV | LV | Ship | Plane | ST | Harbor | Bridge | TC |
|---|
| SSD | 35.65 | 66.11 | 66.29 | 80.12 | 54.04 | 76.20 | 59.25 | 77.27 | | BGC | 80.99 | 78.09 | 80.10 | 87.24 | 87.31 | 78.77 | 80.21 | 86.94 | | Object category | RA | SF | HP | GFT | BD | SP | BC | | | SSD | 77.36 | 67.46 | 66.84 | 78.96 | 85.21 | 73.63 | 77.70 | | | BGC | 88.87 | 79.46 | 79.20 | 80.51 | 88.06 | 84.56 | 82.48 | |
|
Table 3. Comparsion of average coverage for each category in DOTA of default object frame parameters set by two methods%
| Experiment No. | Model | Aps /% | APless /% | mAP /% | FPS |
|---|
| 1 | SSD | 33.5 | 52.5 | 55.9 | 26 | | 2 | SSD+MSFF_U | 44.3 | 63.5 | 64.6 | 24 | | 3 | SSD+BGC | 49.5 | 62.4 | 63.6 | 16 | | 4 | SSD+BGC+MSFF_U (FFC-SSD) | 69.3 | 69.9 | 74.9 | 15 | | 5 | SSD+BGC+MSFF_D | 63.4 | 64.4 | 70.0 | 12 |
|
Table 4. Influence of each module on mAP and FPS of object detection
| Model | SSD[1] | YOLOv3[9] | FRCNN[2,20] | DSSD[15,21] | FMSSD[15] | FFC-SSD |
|---|
| Plane | 84.2 | 91.0 | 80.3 | 91.1 | 89.1 | 88.4 | | Small vehicle | 39.9 | 40.3 | 53.6 | 79.0 | 69.2 | 82.5 | | Large vehicle | 55.9 | 76.9 | 52.5 | 77.2 | 73.6 | 76.4 | | Roundabout | 52.6 | 58.5 | 49.8 | 72.6 | 67.5 | 74.1 | | Bridge | 25.7 | 50.0 | 32.9 | 54.6 | 48.2 | 51.0 | | Soccer field | 56.7 | 18.0 | 57.0 | 38.0 | 52.7 | 62.0 | | Helicopter | 33.0 | 85.2 | 41.9 | 28.9 | 60.2 | 54.3 | | AP | Ground field track | 54.8 | 30.2 | 68.1 | 66.4 | 68.0 | 74.7 | | Baseball diamond | 72.7 | 68.3 | 77.6 | 71.8 | 81.5 | 78.3 | | Storage tank | 61.7 | 82.1 | 59.6 | 69.7 | 73.3 | 87.2 | | Tennis court | 80.4 | 92.0 | 90.4 | 87.6 | 90.7 | 90.6 | | Swimming pool | 62.0 | 80.2 | 56.5 | 59.4 | 80.6 | 73.0 | | Ship | 65.9 | 89.2 | 50.0 | 87.5 | 76.9 | 87.4 | | Harbor | 48.4 | 69.3 | 61.7 | 75.4 | 72.4 | 67.2 | | Basketball court | 45.3 | 62.4 | 75.1 | 52.1 | 82.7 | 76.2 | | mAP | 55.9 | 66.2 | 60.6 | 67.4 | 72.4 | 74.9 | | stdAP | 15.8 | 22.2 | 14.9 | 17.4 | 11.7 | 11.6 | | FPS | 26 | 13 | 7 | 9 | 16 | 15 |
|
Table 5. Detection performance of FFC-SSD and other models on DOTA dataset%
| Model | SSD[1] | YOLOv3[9] | FRCNN[2,15] | FMSSD[15] | FFC-SSD |
|---|
| Plane | 98.2 | 95.6 | 94.6 | 99.7 | 99.7 | | Ship | 83.9 | 88.6 | 82.3 | 89.9 | 96.3 | | Storage tank | 75.9 | 77.9 | 65.3 | 90.3 | 88.1 | | Baseball diamond | 90.2 | 91.7 | 95.5 | 98.2 | 99.4 | | AP | Tennis court | 85.6 | 89.1 | 81.9 | 86.0 | 90.3 | | Basketball court | 79.6 | 89.8 | 89.7 | 96.8 | 99.4 | | Ground track field | 92.2 | 84.8 | 92.4 | 99.6 | 99.9 | | Harbor | 77.1 | 81.2 | 72.4 | 75.6 | 96.1 | | Bridge | 67.8 | 70.8 | 57.5 | 80.1 | 98.5 | | Vehicle | 75.6 | 87.8 | 77.8 | 88.2 | 89.0 | | mAP | 82.6 | 85.7 | 80.9 | 90.4 | 95.7 | | stdAP | 8.70 | 6.92 | 12.19 | 7.89 | 4.49 |
|
Table 6. Detection performance of FFC-SSD and other models on NWPU VHR-10 dataset%
| Model | NWPU VHR-10 | RSOD | UCAS-AOD |
|---|
| SSD | 61.7 | 45.1 | 48.9 | | FFC-SSD | 76.5 | 60.2 | 69.6 |
|
Table 7. mAP of different models on three optical remote sensing datasets%