
Guo Tang, Xingsheng Deng, Qingyang Wang. Point Cloud Filtering Algorithm Based on Density Clustering[J]. Laser & Optoelectronics Progress, 2022, 59(16): 1628004
- Laser & Optoelectronics Progress
- Vol. 59, Issue 16, 1628004 (2022)
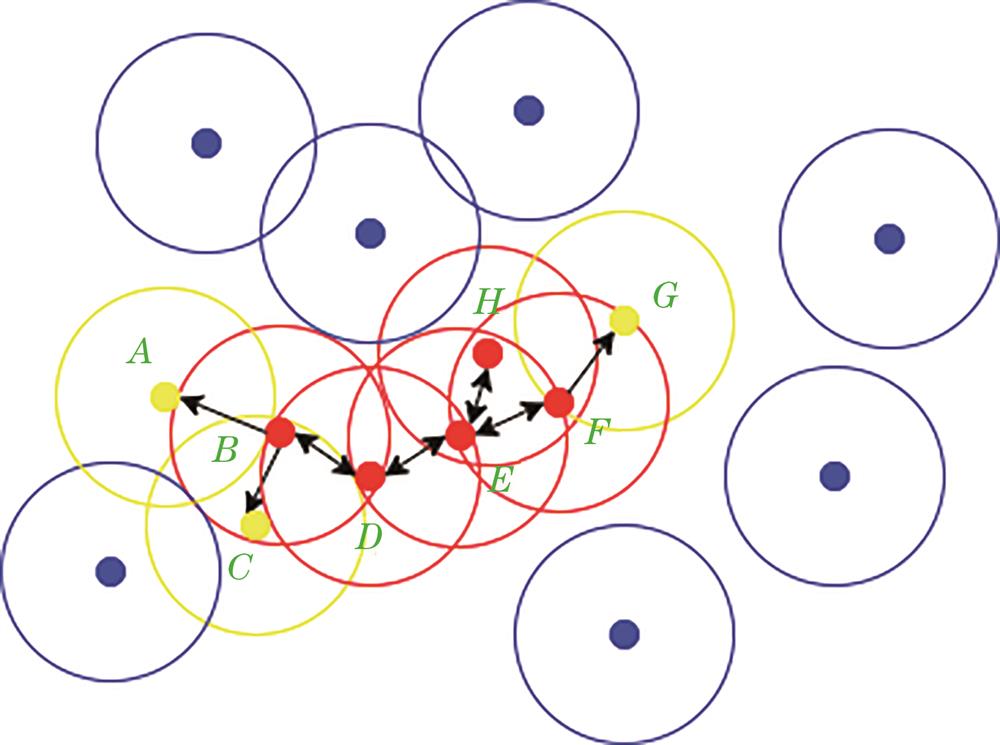
Fig. 1. Schematic diagram of DBSCAN
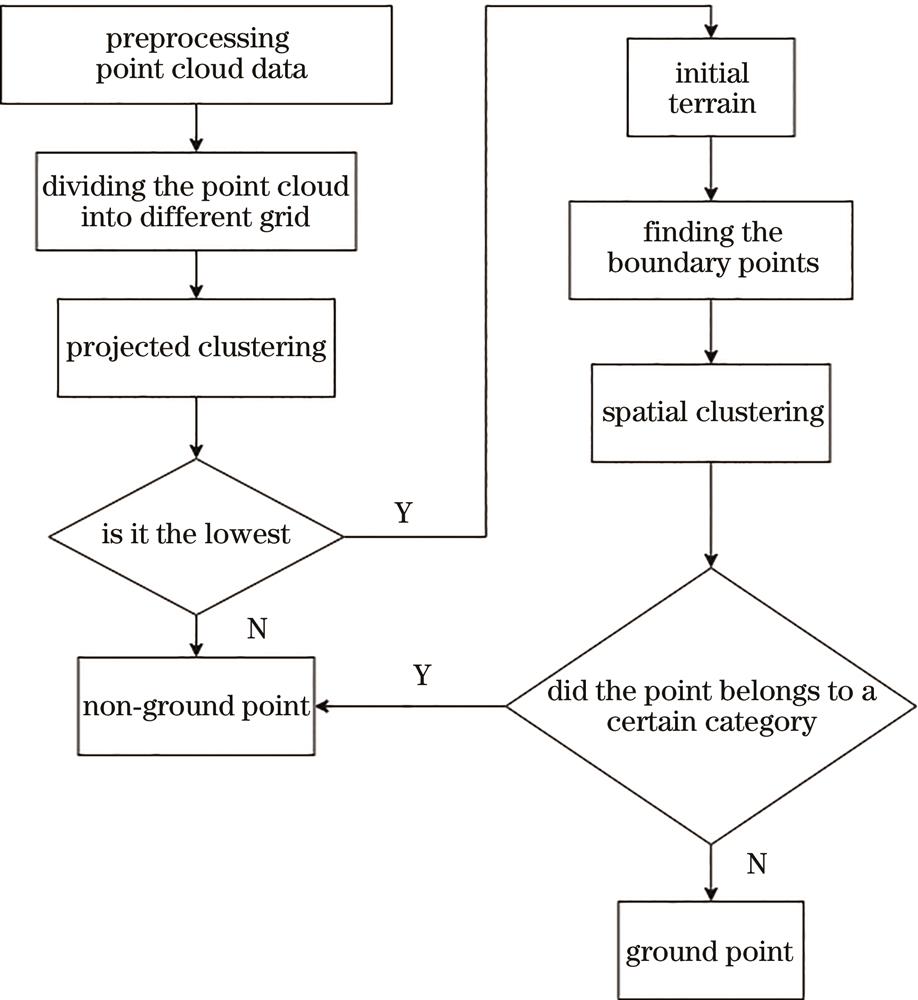
Fig. 2. Flow chart of point cloud filtering algorithm based on density clustering
Fig. 3. Simulation map of laser point cloud position in large survey area
Fig. 4. 3D view of S53
Fig. 5. Elevation map of S53
Fig. 6. Filtering result map of S53
Fig. 7. Error point location map of S53
Fig. 8. Relief image after filtering of S53
Fig. 9. Section plane comparison diagram of S53
Fig. 10. Schematic diagram of classification error
Fig. 11. 3D view of S61
Fig. 12. Elevation map of S61
Fig. 13. Filtering result map of S61
Fig. 14. Error point location map of S61
Fig. 15. Relief image after filtering of S61
Fig. 16. Section plane comparison diagram of S61
Fig. 17. 3D view of S21
Fig. 18. Filtering result map of S21
Fig. 19. Relief image after filtering of S21
Fig. 20. Error point location map of S21
Fig. 21. Mutation point location map of S21
Fig. 22. Re-division result map of S21
Fig. 23. Relief image before filtering of S24
Fig. 24. Elevation map of S24
Fig. 25. Filtering result map of S24
Fig. 26. Error point location map of S24
Fig. 27. Relief image after filtering of S24
Fig. 28. Section plane comparison diagram of S24
Fig. 29. 3D view of S71
Fig. 30. Filtering result map of S71
Fig. 31. Relief image after filtering of S71
Fig. 32. Error point location map of S71
Fig. 33. Mutation point location map of S71
Fig. 34. Re-division result map of S71
| ||||||||||||||||||||
Table 1. Definition of filtering error
|
Table 2. Filter error statistics of S53
|
Table 3. Comparison of S53 total filtering error with other filtering algorithms
|
Table 4. Filter error statistics of S61
|
Table 5. Comparison of S61 total filtering error with other filtering algorithms
|
Table 6. Filter error statistics of S21
|
Table 7. Comparison of S21 total filtering error with other filtering algorithms
|
Table 8. Filter error statistics of S24
|
Table 9. Comparison of S24 total filtering error with other filtering algorithms
|
Table 10. Filter error statistics of S71
|
Table 11. Comparison of S53 total filtering error with other filtering algorithms

Set citation alerts for the article
Please enter your email address
© Copyright 2018-2021 | Chinese Laser Press. All Rights Reserved 沪ICP备15018463号-20