
Jie Zhang, Yipeng Liao, Lu Dai, Xueyan Li. Low Brightness Image Enhancement Based on Quantum Harmony Search Fuzzy Sets in NSCT Domain[J]. Laser & Optoelectronics Progress, 2021, 58(24): 2415008
- Laser & Optoelectronics Progress
- Vol. 58, Issue 24, 2415008 (2021)
Fig. 1. Schematic diagram of HS algorithm
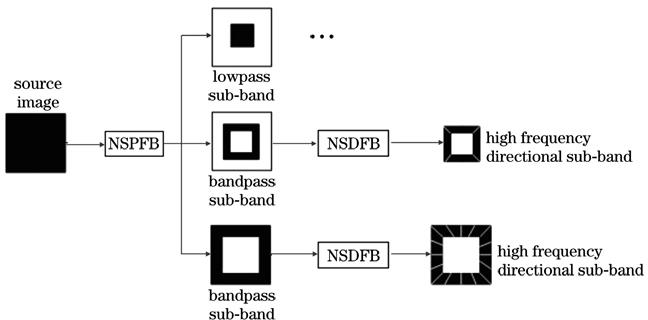
Fig. 2. Decomposition diagram of NSCT
Fig. 3. Enhancement and contrast of coin images. (a) Original coin image; (b) image of low frequency sub-band; (c) processing result of low frequency sub-band; (d) image of high frequency scale 1; (e) image of high frequency scale 2; (f) image of high frequency scale 3; (g) processing result of high frequency scale 1; (h) processing result of high frequency scale 2; (i) processing result of high frequency scale 3; (j) enhancement result obtained by proposed method; (k) enhancement result obtained by homomorphic filtering method; (l) enhancement result obtained by wavelet transform; (m) enhancement result obtained by Retinex algorithm; (n) enhancement result obtained by method in Ref. [7]; (o) enhancement result obtained by method in Ref. [8]; (p) enhancement result obtained by method based on original QHS optimize to fuzzy sets
Fig. 4. Enhancement and contrast of human skeleton images. (a) Human skeleton image; (b) enhancement result obtained by proposed method; (c) enhancement result obtained by homomorphic filtering method; (d) enhancement result obtained by wavelet transform; (e) enhancement result obtained by Retinex algorithm; (f) enhancement result obtained by method in Ref. [7]; (g) enhancement result obtained by method in Ref. [8]; (h) enhancement result obtained by method based on original QHS optimize to fuzzy sets
Fig. 5. Enhancement and contrast of infrared images. (a) Infrared image; (b) enhancement result obtained by proposed method; (c) enhancement result obtained by homomorphic filtering method; (d) enhancement result obtained by wavelet transform; (e) enhancement result obtained by Retinex algorithm; (f) enhancement result obtained by method in Ref. [7]; (g) enhancement result obtained by method in Ref. [8]; (h) enhancement result obtained by method based on original QHS optimize to fuzzy sets
Fig. 6. Denoising and edge enhancement effect of coin noise images. (a) Original coin image; (b) noisy image; (c) enhancement result obtained by proposed method; (d) edge detection result of Fig. 6 (c); (e) image of low frequency sub-band; (f) image of high frequency scale 1; (g) image of high frequency scale 2; (h) image of high frequency scale 3; (i) processing result of low frequency sub-band; (j) processing result of high frequency scale 1; (k) processing result of high frequency scale 2; (l) processing result of high frequency scale 3; (m) enhancement result obtained by homomorphic filtering method; (n) enhancement result obtained by wavelet transform; (o) enhancement result obtained by Retinex algorithm; (p) enhancement result obtained by method in Ref. [7]; (q) enhancement result obtained by method in Ref. [8]; (r) edge detection result of Fig. 6 (a); (s) edge detection result of Fig. 6 (m); (t) edge detection result of Fig. 6 (n); (u) edge detection result of Fig. 6 (o); (v) edge detection result of Fig. 6 (p); (w) edge detection result of Fig. 6 (q)
|
Table 1. Benchmark functions
|
Table 2. Parameter testing of λ and Δθ
|
Table 3. Performance testing of different algorithms
|
Table 4. Quantitative comparison of enhancement effects of coin images
|
Table 5. Quantitative comparison of enhancement effects of human skeleton images
|
Table 6. Quantitative comparison of enhancement effects of infrared images
|
Table 7. PSNR and texture correlation of coin noisy images enhanced by different methods

Set citation alerts for the article
Please enter your email address
© Copyright 2018-2021 | Chinese Laser Press. All Rights Reserved 沪ICP备15018463号-20