
Xu Fang, Guanghui Wang, Huachao Yang, Huijie Liu, Libo Yan. High Resolution Remote Sensing Image Classification Combining with Mean-Shift Segmentation and Fully Convolution Neural Network[J]. Laser & Optoelectronics Progress, 2018, 55(2): 022802
- Laser & Optoelectronics Progress
- Vol. 55, Issue 2, 022802 (2018)
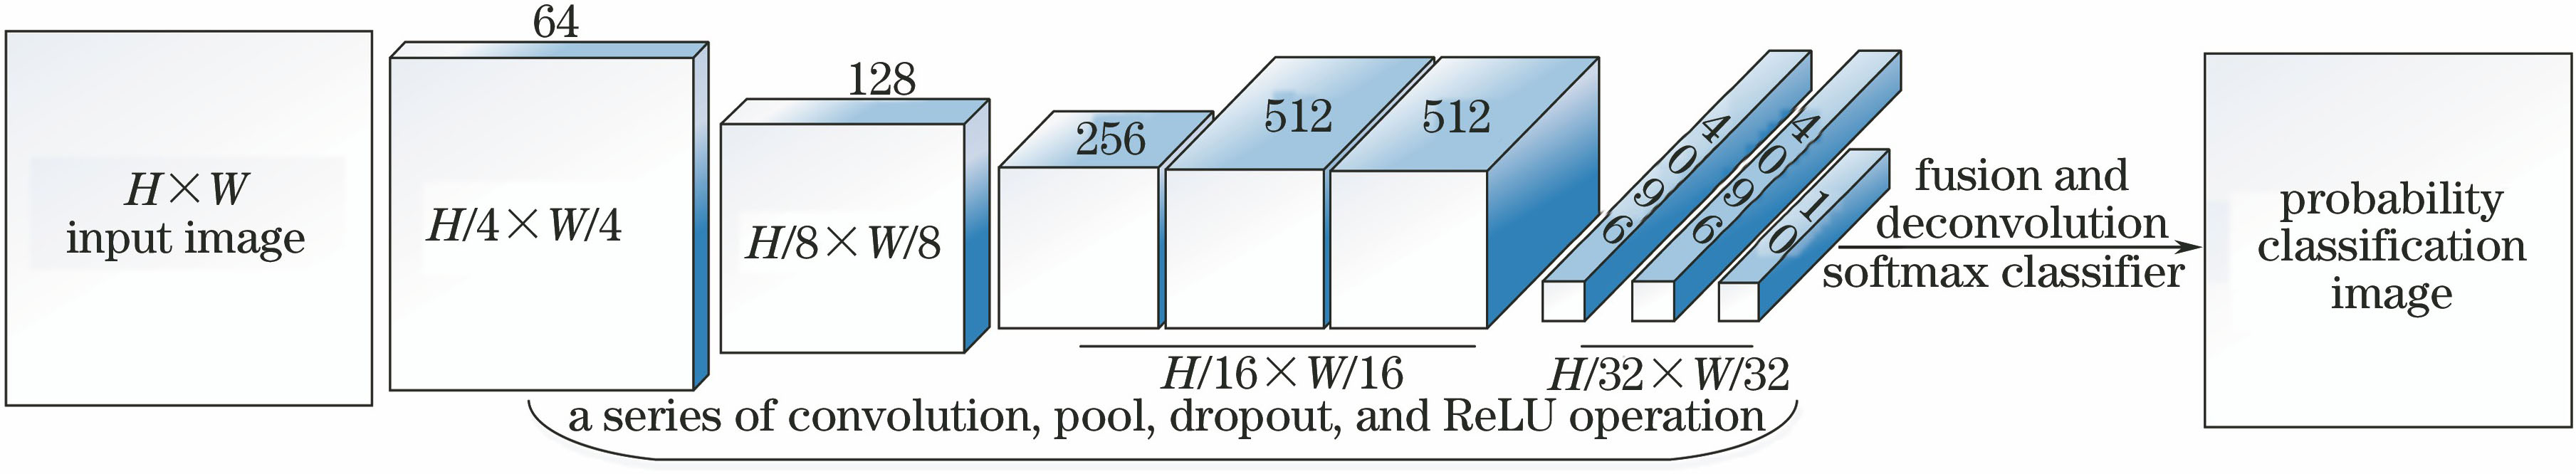
Fig. 1. Basic structure of FCN
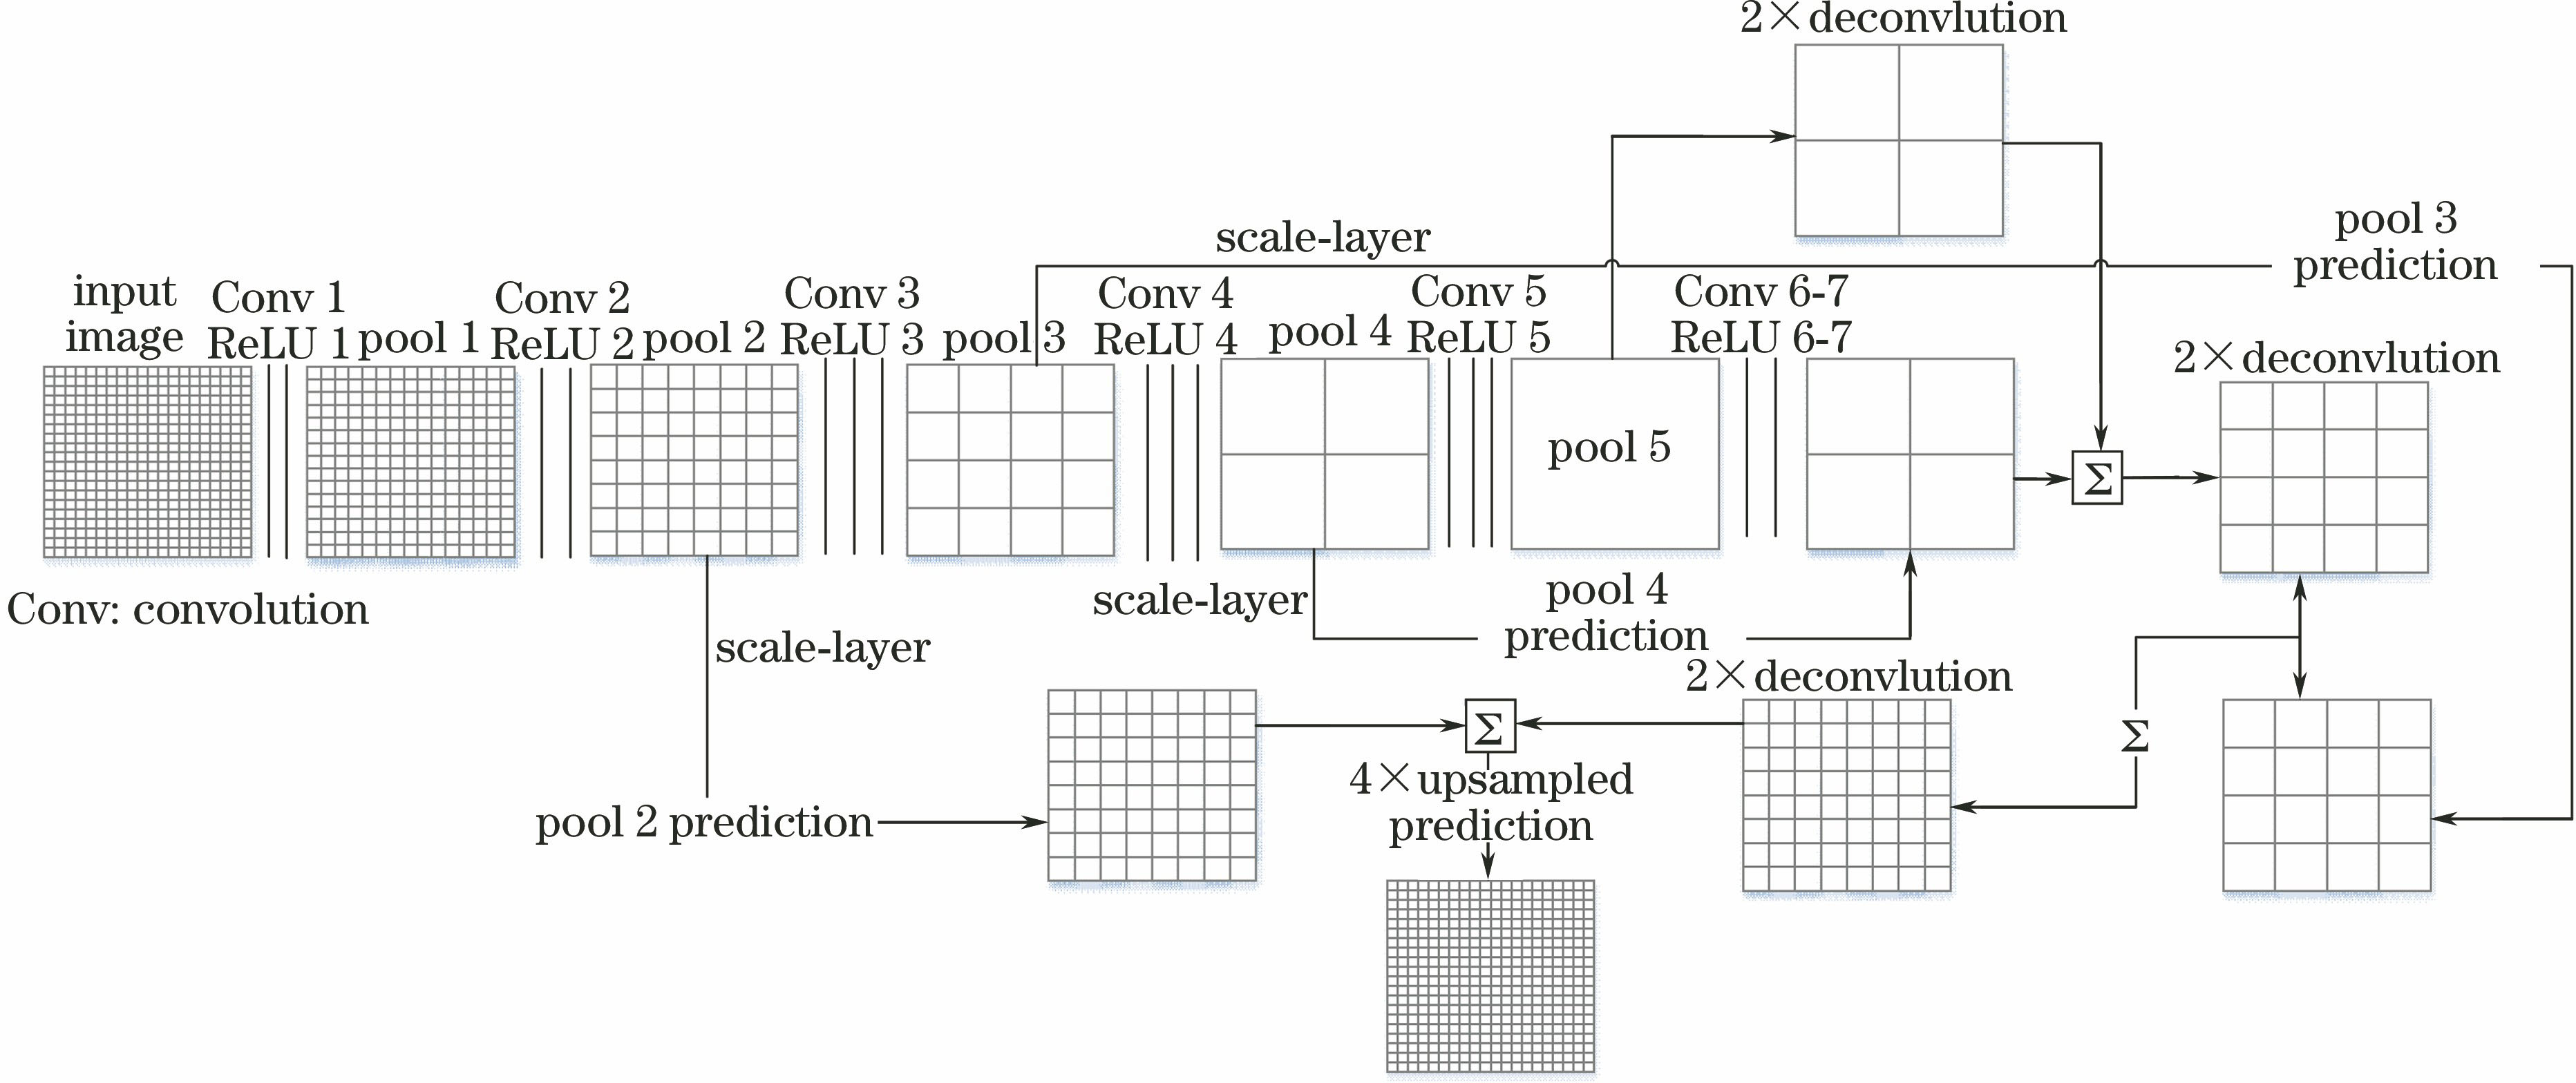
Fig. 2. Diagram of network structure
Fig. 3. Diagram of regional consolidation
Fig. 4. Flow chart of classification method
Fig. 5. Original images and tag data examples. (a) Example 1; (b) example 2
Fig. 6. Classification results of different methods. (a) Original image; (b) segmentation result of mean-shift ①;(c) segmentation result of mean-shift ②; (d) segmentation result of mean-shift ③; (e) true classification image;(f) classification result of SVM ; (g) classification result of ANN; (h) classification result of FCN-16; (i) classification result of FCN-8; (j) classification result of proposed FCN; (k) classification result of proposed FCN adding segmentation result of mean-shift ①; (l) classifi
Fig. 7. Marked images of some details. (a) True classification image; (b) classification result of FCN-16; (c) classification result of proposed FCN adding segmentation result of mean-shift ②
| ||||||||||||||||||||||||||||||||||||||||||||||||||||||||
Table 1. Confusion matrice and overall accuracy of SVM classification method%
| ||||||||||||||||||||||||||||||||||||||||||||||||||||||||
Table 2. Confusion matrice and overall accuracy of ANN classification method%
| ||||||||||||||||||||||||||||||||||||||||||||||||||||||||
Table 3. Confusion matrice and overall accuracy of FCN-16 classification method%
| ||||||||||||||||||||||||||||||||||||||||||||||||||||||||
Table 4. Confusion matrice and overall accuracy of FCN-8 classification method%
| ||||||||||||||||||||||||||||||||||||||||||||||||||||||||
Table 5. Confusion matrice and overall accuracy of proposed FCN classification method%
| ||||||||||||||||||||||||||||||||||||||||||||||||||||||||
Table 6. Confusion matrice and overall accuracy of proposed FCN adding segmentation result of mean-shift ①%
| ||||||||||||||||||||||||||||||||||||||||||||||||||||||||
Table 7. Confusion matrice and overall accuracy of proposed FCN adding segmentation result of mean-shift ②%
| ||||||||||||||||||||||||||||||||||||||||||||||||||||||||
Table 8. Confusion matrice and overall accuracy of proposedFCN adding segmentation result of mean-shift ③%

Set citation alerts for the article
Please enter your email address
© Copyright 2018-2021 | Chinese Laser Press. All Rights Reserved 沪ICP备15018463号-20