• Acta Optica Sinica
  • Vol. 38, Issue 8, 0815020 (2018)
Qihan Zhao1、*, Yonghong Wang1、*, Xinya Gao1, Fangyuan Sun1, Peizheng Yan1, and Lianxiang Yang1、2
Author Affiliations
  • 1 School of Instrument Science and Opto-Electronics Engineering, Hefei University of Technology, Hefei, Anhui 230009, China
  • 2 Department of Mechanical Engineering, Oakland University, Rochester, Michigan 48309, USA
  • show less
    DOI: 10.3788/AOS201838.0815020 Cite this Article Set citation alerts
    Qihan Zhao, Yonghong Wang, Xinya Gao, Fangyuan Sun, Peizheng Yan, Lianxiang Yang. Filtering Evaluation Method of Phase Images Based on Smooth Spline Fitting[J]. Acta Optica Sinica, 2018, 38(8): 0815020 Copy Citation Text show less
    Phase map and phase distribution before and after filtering. (a) Original wrapped phase map; (b) phase distribution on the diagonal section of the original wrapped phase map; (c) filtered wrapped phase map; (d) phase distribution on the diagonal section of the filtered wrapped phase map
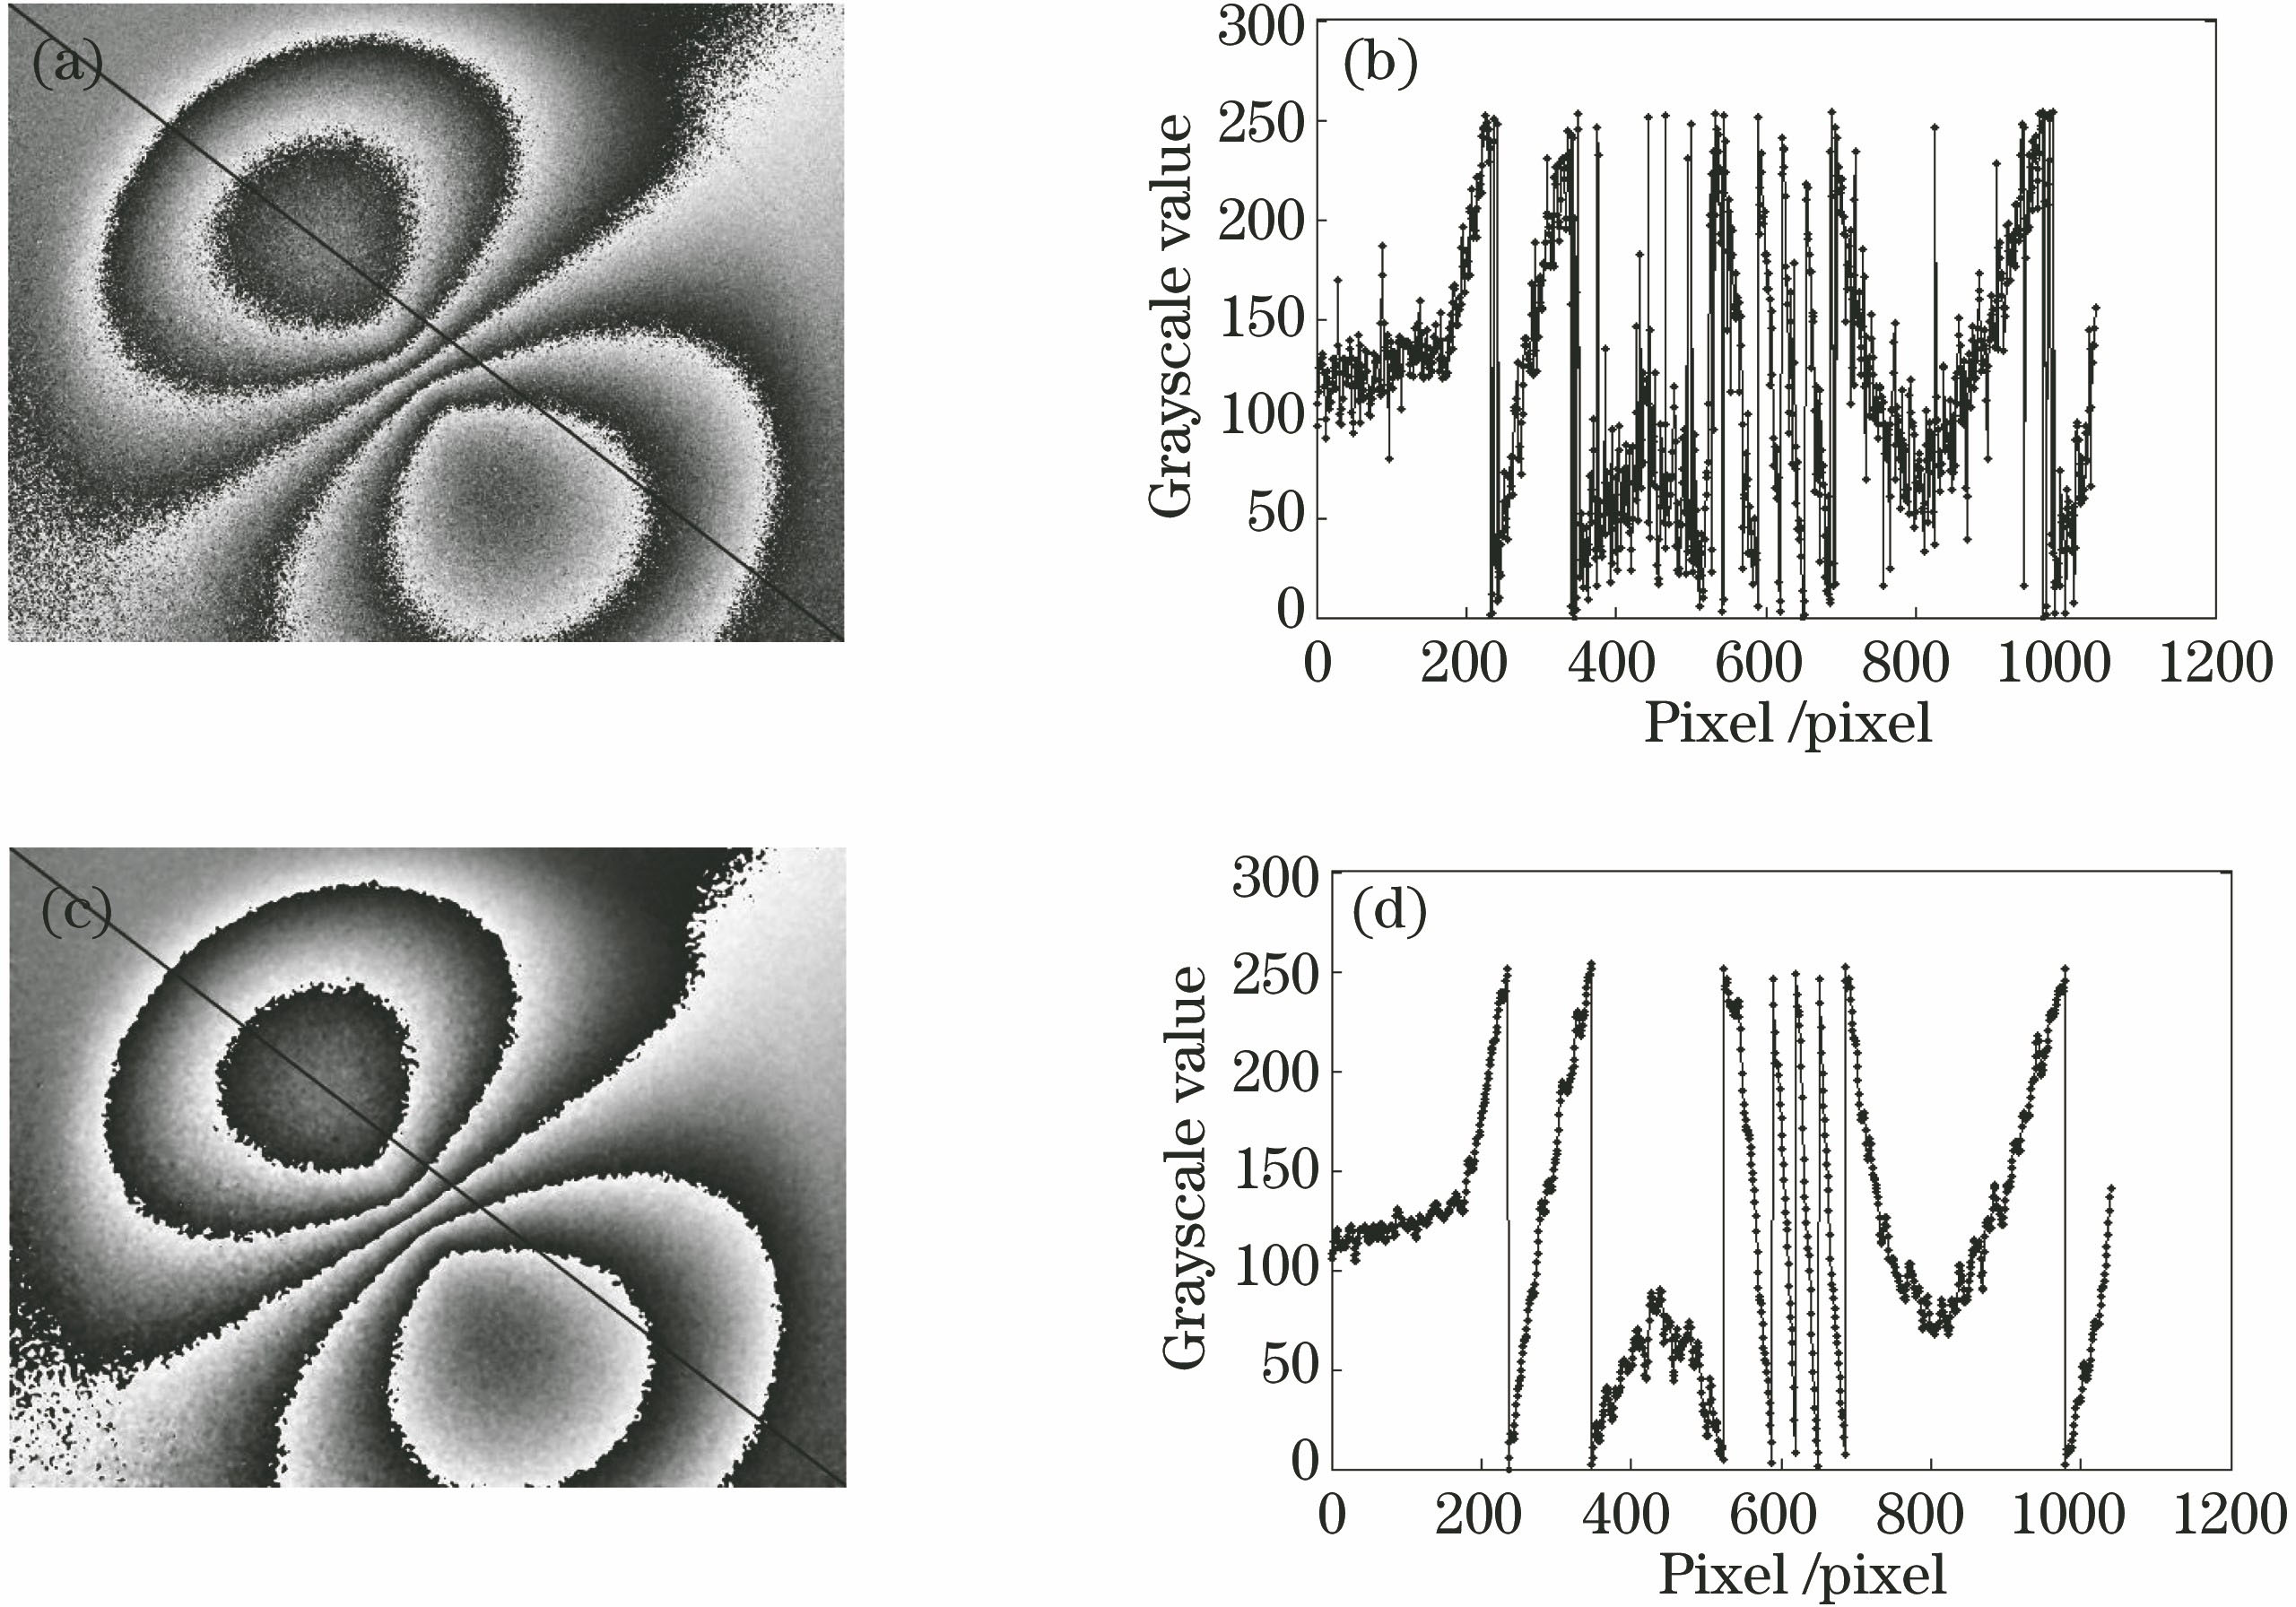
    Fig. 1. Phase map and phase distribution before and after filtering. (a) Original wrapped phase map; (b) phase distribution on the diagonal section of the original wrapped phase map; (c) filtered wrapped phase map; (d) phase distribution on the diagonal section of the filtered wrapped phase map
    Fitting results. (a) Fitting result of phase distribution of the original wrapped phase map; (b) fitting result of phase distribution of the filtered wrapped phase map
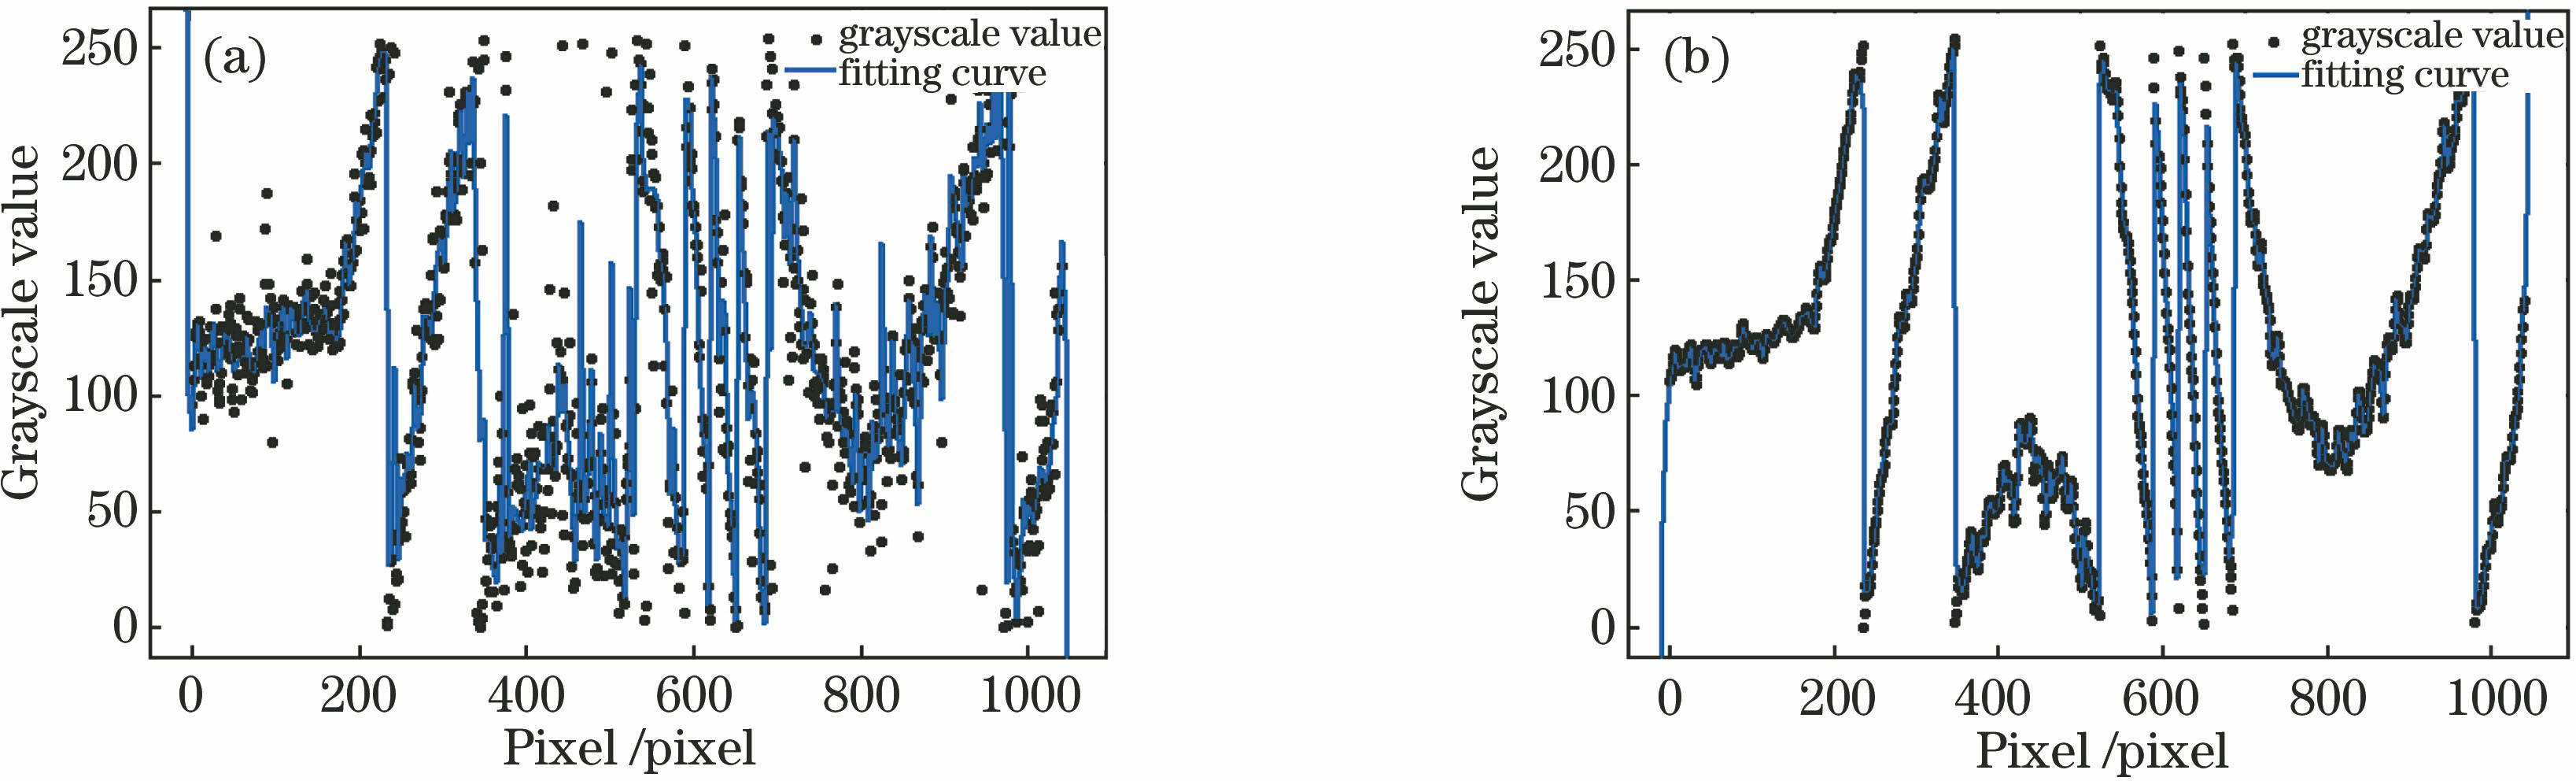
    Fig. 2. Fitting results. (a) Fitting result of phase distribution of the original wrapped phase map; (b) fitting result of phase distribution of the filtered wrapped phase map
    Line chart of RMSE
    Fig. 3. Line chart of RMSE
    Experimental images. (a) Full width butterfly fringe pattern 1; (b) full width butterfly fringe pattern 2; (c) full width circle fringe pattern; (d) local speckle fringe pattern; (e) full width circle fringe pattern under the wide field; (f) fringe pattern of sample with multiple defects
    Fig. 4. Experimental images. (a) Full width butterfly fringe pattern 1; (b) full width butterfly fringe pattern 2; (c) full width circle fringe pattern; (d) local speckle fringe pattern; (e) full width circle fringe pattern under the wide field; (f) fringe pattern of sample with multiple defects
    Line charts of ERMS. (a)-(f) Line charts of ERMS of the experimental images in Fig. 4
    Fig. 5. Line charts of ERMS. (a)-(f) Line charts of ERMS of the experimental images in Fig. 4
    Differential data distribution of ERMS
    Fig. 6. Differential data distribution of ERMS
    Filtering completed images. (a)-(f) Filtering completed images of the experimental images in Fig. 4
    Fig. 7. Filtering completed images. (a)-(f) Filtering completed images of the experimental images in Fig. 4
    Unwrapping phase maps. (a)-(f) Unwrapping phase maps of the experimental images in Fig. 4
    Fig. 8. Unwrapping phase maps. (a)-(f) Unwrapping phase maps of the experimental images in Fig. 4
    Qihan Zhao, Yonghong Wang, Xinya Gao, Fangyuan Sun, Peizheng Yan, Lianxiang Yang. Filtering Evaluation Method of Phase Images Based on Smooth Spline Fitting[J]. Acta Optica Sinica, 2018, 38(8): 0815020
    Download Citation