• Chinese Optics Letters
  • Vol. 19, Issue 5, 051201 (2021)
Huicong Li1、2, Wentao Zhang1、2、*, Wenzhu Huang1、2, and Yanliang Du3、**
Author Affiliations
  • 1Optoelectronic System Laboratory, Institute of Semiconductors, Chinese Academy of Sciences, Beijing 100083, China
  • 2College of Materials Science and Opto-Electronic Technology, University of Chinese Academy of Sciences, Beijing 100049, China
  • 3College of Civil and Transportation Engineering, Shenzhen University, Shenzhen 518060, China
  • show less
    DOI: 10.3788/COL202119.051201 Cite this Article Set citation alerts
    Huicong Li, Wentao Zhang, Wenzhu Huang, Yanliang Du. Design of low frequency fiber optic Fabry–Perot seismometer based on transfer function analysis[J]. Chinese Optics Letters, 2021, 19(5): 051201 Copy Citation Text show less
    Configuration of fiber optic F-P seismometer. (a) The seismometer’s structure. The mirror and trimmer are not plotted. (b) The F-P interferometer in the fiber optic seismometer.
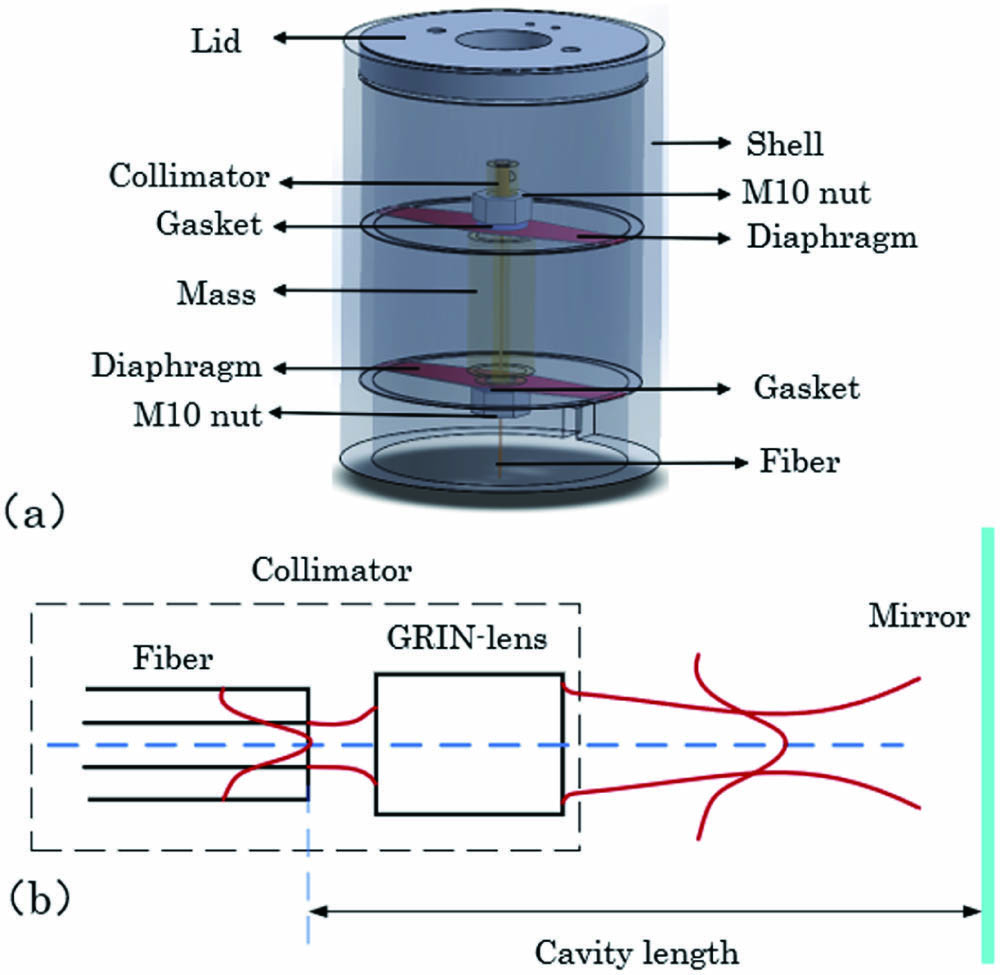
    Fig. 1. Configuration of fiber optic F-P seismometer. (a) The seismometer’s structure. The mirror and trimmer are not plotted. (b) The F-P interferometer in the fiber optic seismometer.
    Mechanical equivalent model of the seismometer.
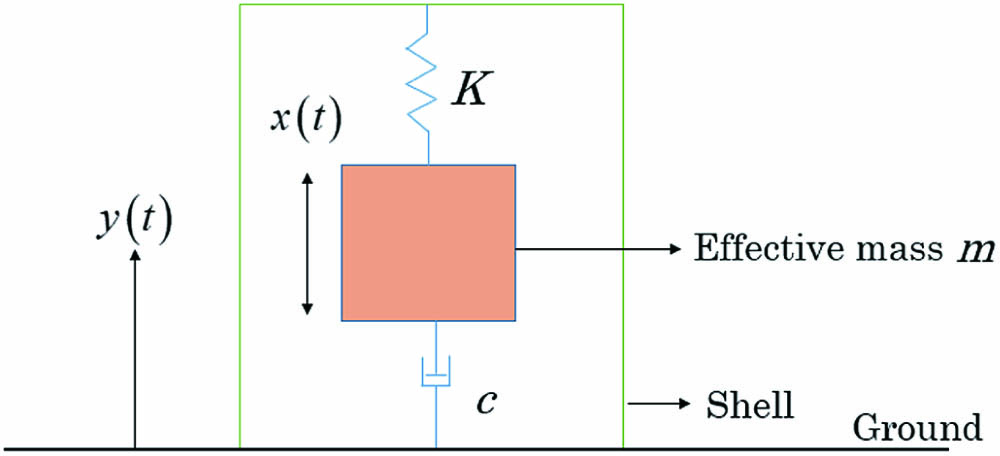
    Fig. 2. Mechanical equivalent model of the seismometer.
    Estimation of the MDS. The black solid line represents the MDS corresponding to demodulation accuracy, while the order lines represent the MDS corresponding to the NLNM at different resonance points.
    Fig. 3. Estimation of the MDS. The black solid line represents the MDS corresponding to demodulation accuracy, while the order lines represent the MDS corresponding to the NLNM at different resonance points.
    Evaluation of interference normalized intensity. Note that θ=0.1° is assumed.
    Fig. 4. Evaluation of interference normalized intensity. Note that θ=0.1° is assumed.
    Evaluation of the fringe visibility. Note that θ=0.1° is assumed.
    Fig. 5. Evaluation of the fringe visibility. Note that θ=0.1° is assumed.
    Experiment setup. The red lines represent optical fibers, and the blue lines represent electric wires. The direction of the arrows represents the transmission of the signal.
    Fig. 6. Experiment setup. The red lines represent optical fibers, and the blue lines represent electric wires. The direction of the arrows represents the transmission of the signal.
    Result of the visibility of interference fringes.
    Fig. 7. Result of the visibility of interference fringes.
    Power spectral density of phase noise of the F-P seismometer.
    Fig. 8. Power spectral density of phase noise of the F-P seismometer.
    Fitting effect of the transfer function. The circle is the transfer function obtained by the experiment, and the solid line is the fitting.
    Fig. 9. Fitting effect of the transfer function. The circle is the transfer function obtained by the experiment, and the solid line is the fitting.
    Power spectral density of the acceleration noise of the F-P seismometer.
    Fig. 10. Power spectral density of the acceleration noise of the F-P seismometer.
    ParameterValue
    Effective mass158.66 g
    Young’s modulus190 GPa
    Length of diaphragm88 mm
    Width of diaphragm25 mm
    Thickness of diaphragm0.3 mm
    Contact radius8 mm
    Table 1. Key Parameters Used in Design
    Huicong Li, Wentao Zhang, Wenzhu Huang, Yanliang Du. Design of low frequency fiber optic Fabry–Perot seismometer based on transfer function analysis[J]. Chinese Optics Letters, 2021, 19(5): 051201
    Download Citation