Author Affiliations
1Key Lab of All Optical Network and Advanced Telecommunication Network of EMC, Institute of Lightwave Technology, Beijing Jiaotong University, Beijing 100044, China2College of Physics and Engineering, Qufu Normal University, Qufu 273165, Chinashow less
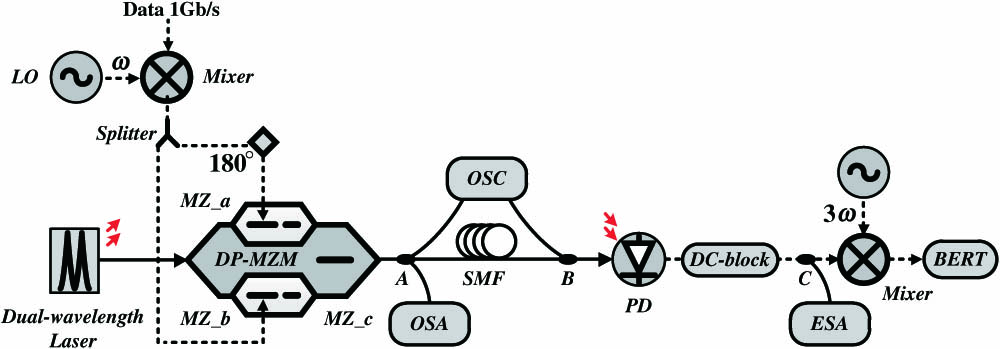
Fig. 1. Block diagram of the proposed v-band signals and pulses generator scheme. LO, local oscillator; SMF, single mode fiber; OSA, optical spectrum analyzer; OSC, oscilloscope; PD, photodiode; ESA, electrical spectrum analyzer; BERT, bit error rate tester.
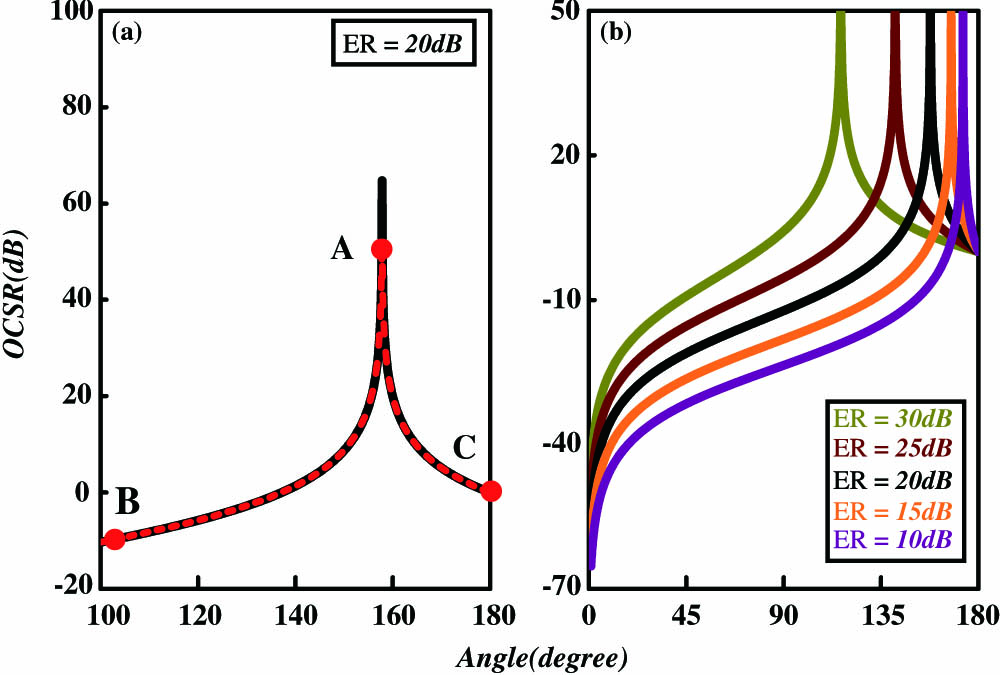
Fig. 2. Calculation and simulation results: (a) OCSR versus bias angle at calculation (black line) and simulation (red line) cases; (b) OCSR versus bias angle with a different extinction ratio (ER).
Fig. 3. Simulation results of the proposed generator when equals 157.8°: (a) optical spectrum at the output of the DP-MZM; (b) electrical spectrum at the output of the PD without SMF transmission (red) and with 20 km SMF transmission(blue); (c) BER curves and corresponding eye diagram, BTB transmission (red), 20 km transmission (blue), and power penalty ().
Fig. 4. Simulation and results of OCSR versus bias voltage drift: (a) the voltage drift effect of , , and , respectively; (b) the voltage drift superposition effect of and ; (c) the voltage drift superposition effect of , , and . (Note that for ease of expression, ‘’ represents voltage drift ranges from 0 to , ‘’ represents voltage drift ranges from to 0 mV, and ‘a, b, c’ represents the , , and , respectively. For example, ‘’ represents voltage drifts of the and , which ranges from 0 to , and the voltage drift of , which ranges from to 0 mV.)
Fig. 5. Simulation results of the proposed generator when equals 102.6°: (a) optical spectrum at the output of the DP-MZM; (b) the waveforms of the generated triangular-shaped pulses with different pulse durations (100 ps yellow line, 66.7 ps green line, 50 ps red line, 40 ps blue line).
Fig. 6. Simulation results of the proposed generator when equals 180°: (a) optical spectrum at the output of the DP-MZM; (b) the waveforms of the generated Nyquist waveform pulses with different pulse durations (100 ps yellow line, 66.7 ps green line, 50 ps red line, 40 ps blue line).