Author Affiliations
1College of Electrical Engineering, North China University of Science and Technology, Tangshan 063210, Hebei , China2Tang Steel International Engineering Technology Co., Ltd., Tangshan 063000, Hebei , Chinashow less
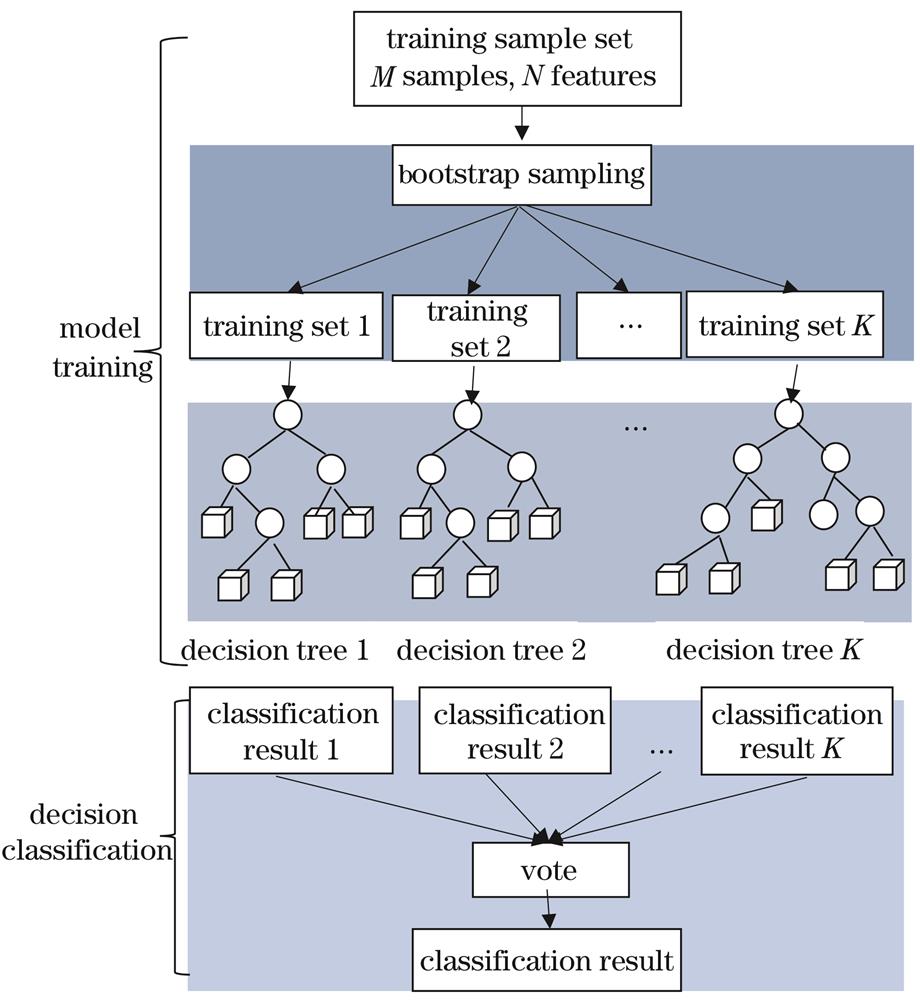
Fig. 1. Flow chart of random forest algorithm
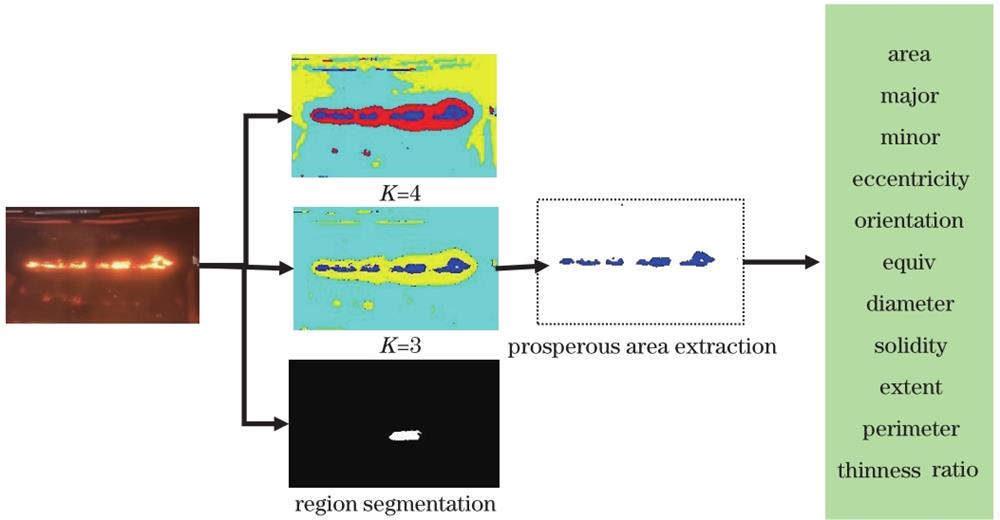
Fig. 2. Pretreatment process
Fig. 3. Geometric features
Fig. 4. Relationship between classification accuracy and number of decision trees
Fig. 5. Performance analysis of conventional random forest
Fig. 6. Performance analysis of improved random forest (K-means)
Fig. 7. Performance analysis of improved random forest(FCM)
Category | Normal burning | Underburning | Overheating | Sum |
---|
Quantity | 140 | 80 | 80 | 300 |
|
Table 1. Number of categories
Geometric feature | Area | Major | Minor | Eccentricity | Orientation |
---|
Accuracy | 0.49 | 0.42 | 0.64 | 0.47 | 0.59 | Geometric feature | Equiv diameter | Solidity | Extent | Perimeter | Thinness ratio | Accuracy | 0.51 | 0.35 | 0.51 | 0.47 | 0.37 |
|
Table 2. Accuracy of K-means
Geometric feature | Area | Major | Minor | Eccentricity | Orientation |
---|
Accuracy | 0.51 | 0.43 | 0.64 | 0.5 | 0.64 | Geometric feature | Equiv diameter | Solidity | Extent | Perimeter | Thinness ratio | Accuracy | 0.51 | 0.48 | 0.39 | 0.47 | 0.46 |
|
Table 3. Accuracy of FCM
Geometric feature | Area | Major | Minor | Eccentricity | Orientation |
---|
Probability | 0.1 | 0.09 | 0.13 | 0.1 | 0.12 | Geometric feature | Equiv diameter | Solidity | Extent | Perimeter | Thinness ratio | Probability | 0.11 | 0.07 | 0.11 | 0.09 | 0.08 |
|
Table 4. K-means geometric feature probability
Geometric feature | Area | Major | Minor | Eccentricity | Orientation |
---|
Probability | 0.1 | 0.08 | 0.13 | 0.1 | 0.13 | Geometric feature | Equiv diameter | Solidity | Extent | Perimeter | Thinness ratio | Probability | 0.1 | 0.1 | 0.08 | 0.09 | 0.09 |
|
Table 5. FCM geometric feature probability
Method | Normal burning | Underburning | Overheating |
---|
method Conventional | 85.71 | 91.67 | 91.67 | SVM(RBF kernel function) | 95.24 | 91.67 | 91.67 | Improvement(K-means) | 97.62 | 95.83 | 100 | Improvement(FCM) | 97.56 | 100 | 95.83 |
|
Table 6. Accuracy of improved random forest algorithm for three categories of images
Method | Normal burning | Underburning | Overheating |
---|
Conventional method | 94.74 | 81.48 | 88 | SVM(RBF kernel function) | 97.56 | 88 | 91.67 | Improvement(K-means) | 97.62 | 95.83 | 100 | Improvement(FCM) | 97.56 | 92.31 | 100 |
|
Table 7. Recall of improved random forest algorithm for three categories of images
Method | Accuracy /% | Precision /% | Recall /% | F1 value /% |
---|
Conventional method | 88.89 | 89.68 | 88.07 | 88.87 | SVM(RBF kernel function) | 93.3333 | 92.86 | 92.41 | 92.63 | Improvement(K-means) | 97.78 | 97.82 | 97.82 | 97.82 | Improvement(FCM) | 96.67 | 97.80 | 96.62 | 97.21 |
|
Table 8. Comparison of overall result