
Haicheng Qu, Xinxin Wang, Jun Ouyang. Infrared Small-Target Detection Based on Hybrid Domain Module and Hole Convolution[J]. Laser & Optoelectronics Progress, 2023, 60(10): 1010002
- Laser & Optoelectronics Progress
- Vol. 60, Issue 10, 1010002 (2023)
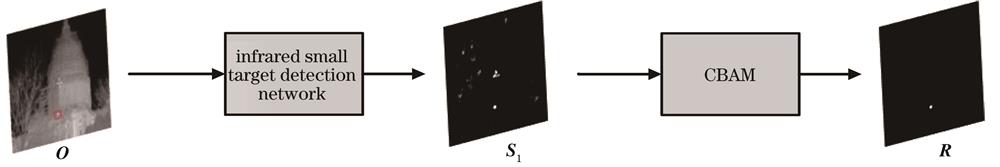
Fig. 1. Detection scheme of proposed algorithm

Fig. 2. Detection scheme of typical FCN
Fig. 3. Detection scheme of MDvsFA_cGAN
Fig. 4. Network structure of proposed algorithm
Fig. 5. Overall flow of CBAM
Fig. 6. Overall flow of CAM
Fig. 7. Overall flow of SAM
Fig. 8. Real infrared images and binarised labels
Fig. 9. Point source generated by PSF combined with rotation transformation
Fig. 10. Synthetic infrared images and labels based on PSF
Fig. 11. Synthetic infrared images and labels based on Mosaic
Fig. 12. Correspondence of indicator variable
Fig. 13. Effects comparison of different epoch
Fig. 14. RF_measure index comparison of typical deep learning model. (a) RF_measure metric iterations for each deep learning model on the IR_GS Dataset; (b) RF_measure metric iterations for each deep learning model on the IR_GMS Dataset
Fig. 15. Comparison of detection results for different algorithms
Fig. 16. Given infrared images and predicted results
|
Table 1. Design parameters of encoding-decoding
|
Table 2. Dataset expansion mode and details
|
Table 3. Comparison of experimental results of typical deep learning model


Set citation alerts for the article
Please enter your email address

© Copyright 2018-2021 | Chinese Laser Press. All Rights Reserved 沪ICP备15018463号-20